

Our 13-year backtest, and what it cannot prove
Thirteen years of point-in-time testing, scored to the day each filing reached the SEC. How the test was built, what it returned, the limits we will not talk around, and why a person reads every list before it goes out.
Last updated September 15, 2026
Not thirteen years. Thirteen regimes.
The window was not chosen for its length. It was chosen for what it contains: a pre-COVID bull market, a crash and the recovery from it, a crypto boom, a growth-led bull that rotated into value, an inflation surge, a rate-hiking cycle and the high-rate years after it, an inverted yield curve (short-term rates paying more than long-term ones), and an index carried by a handful of mega-caps. Several short recessions, several bull markets.
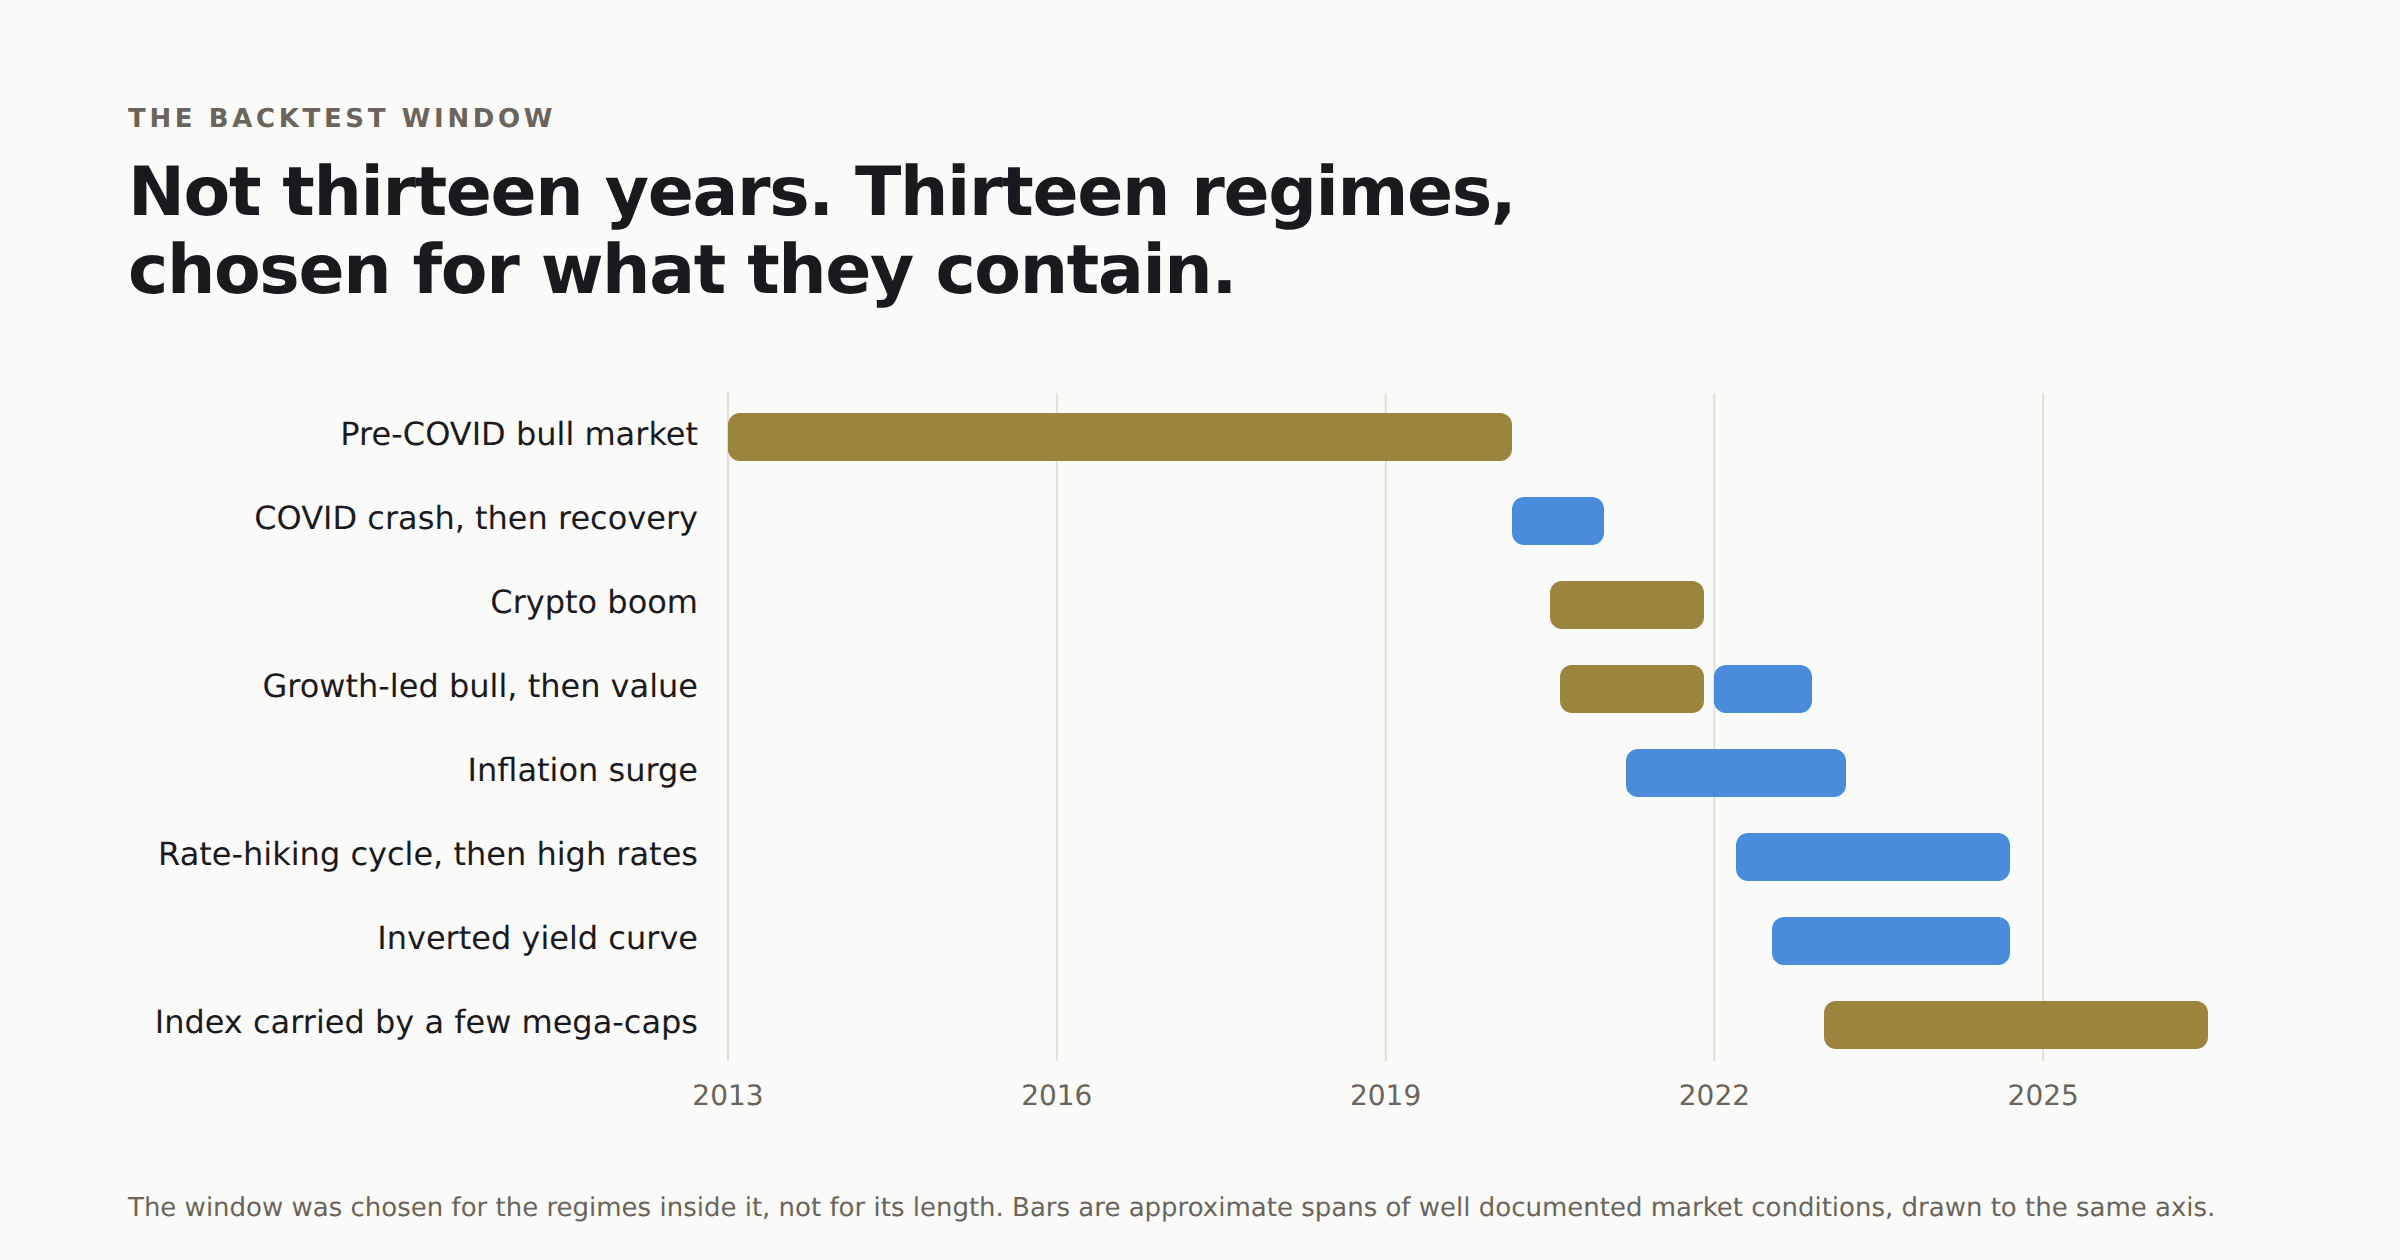
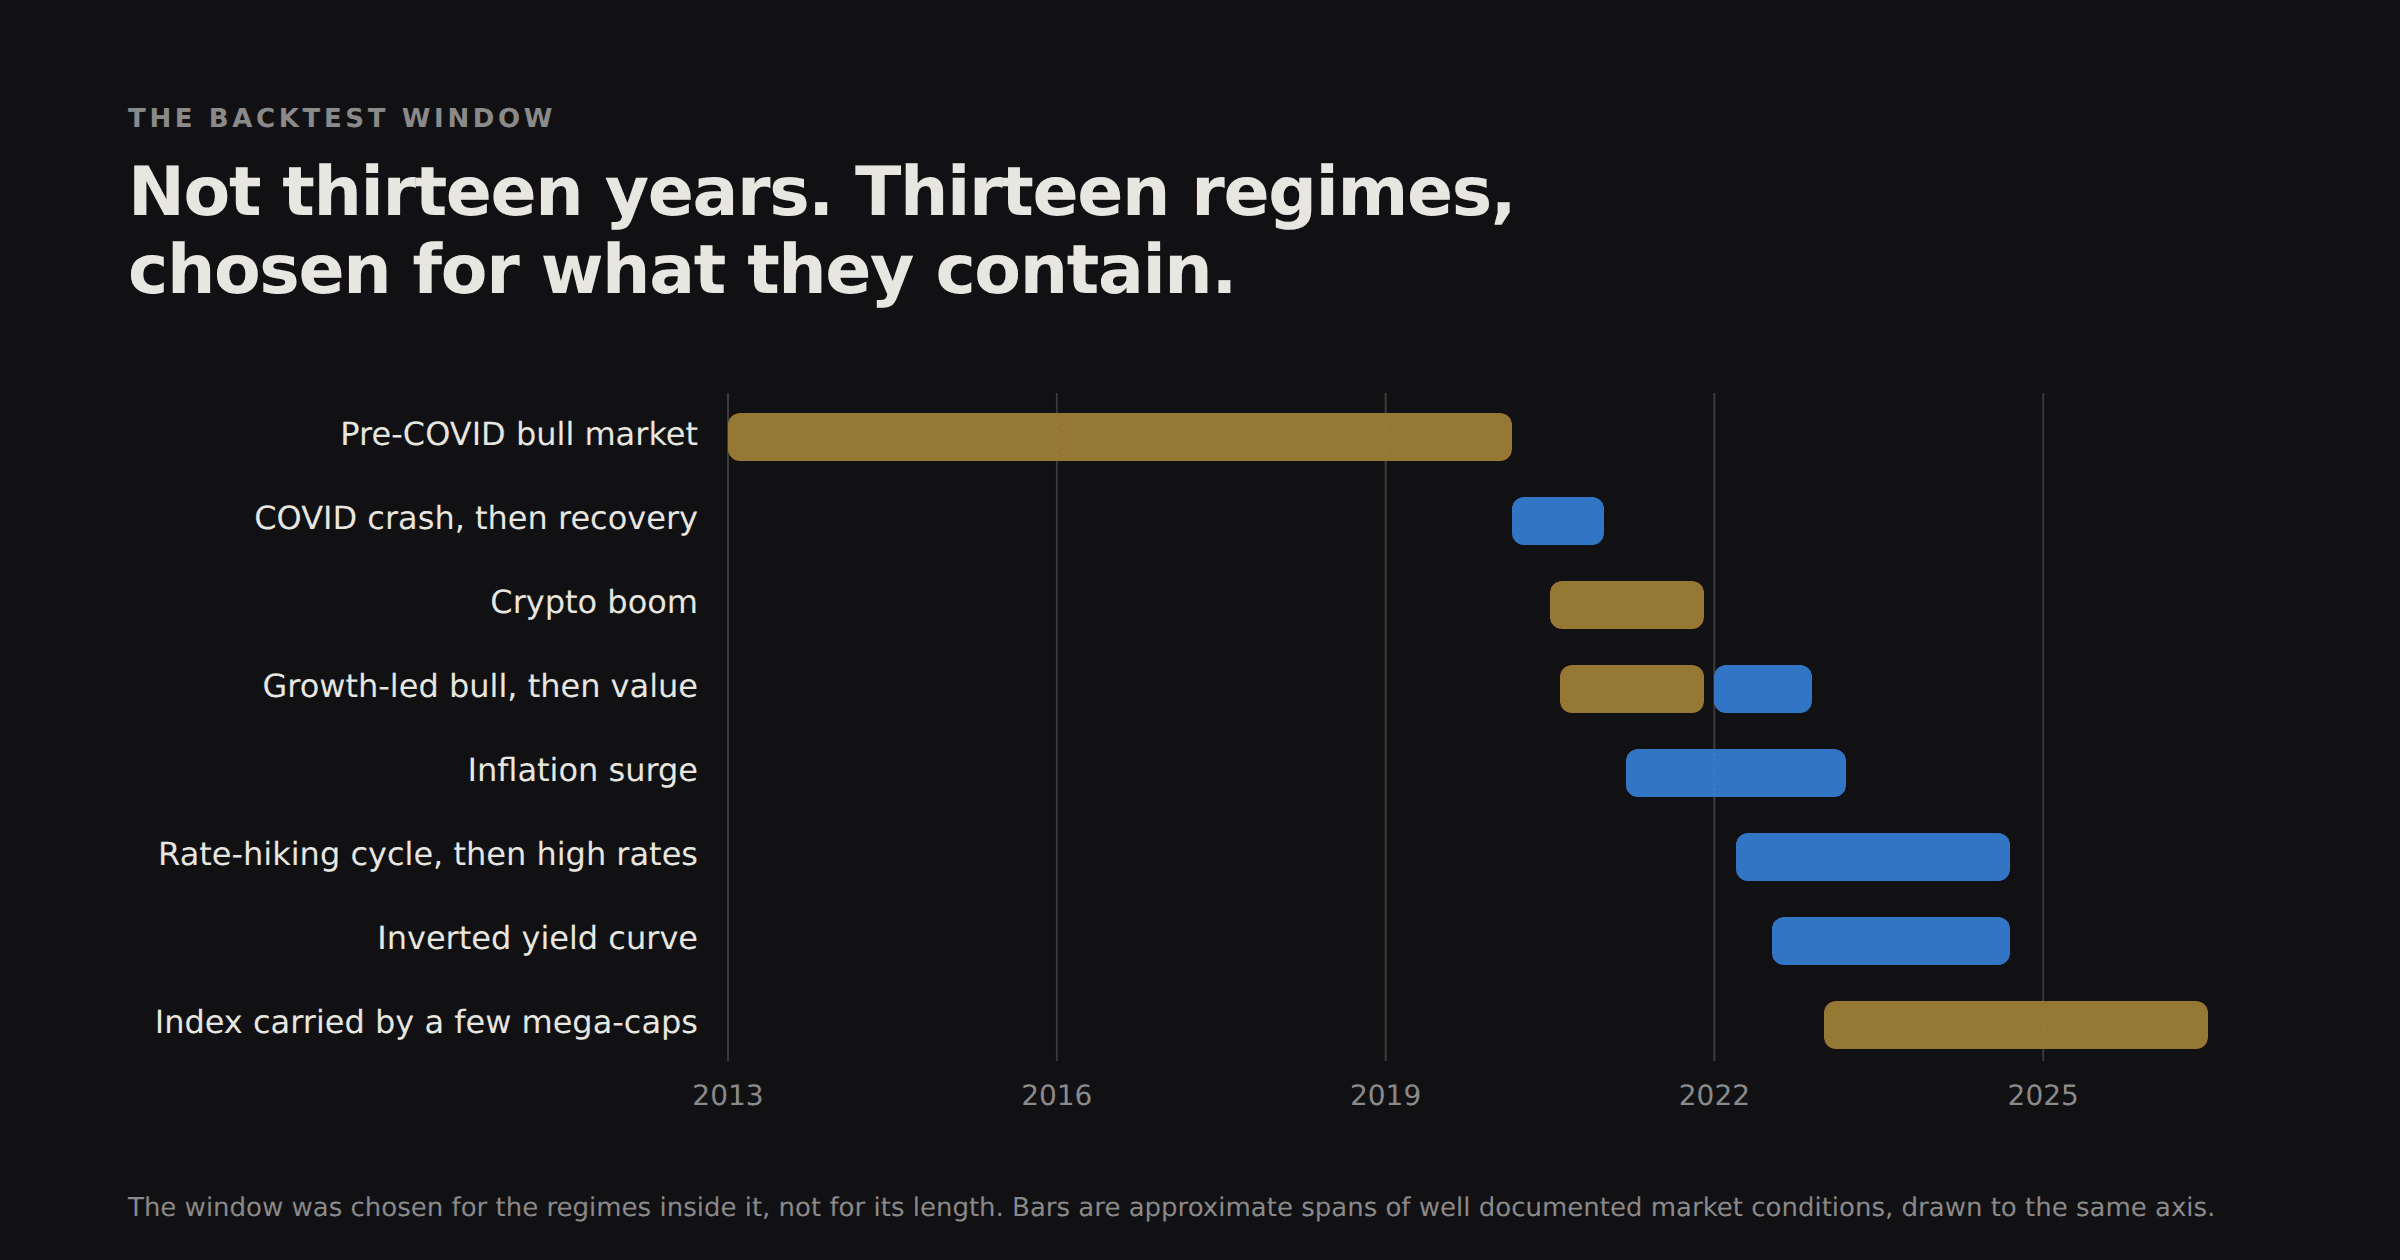
A longer window would have been easy to produce and would have proved less. This stretch describes today's market, and today's turbulence, better than any other period of the same length would. That is the case for it, and it is a stronger one than "as far back as the data goes".
Every month in it is scored on what was public that month, to the day each filing reached the SEC.
Over that period the model compounded at 26.2% a year against 16.2% for a 50/50 S&P 500 / Nasdaq-100 blend, after 20 bps of round-trip cost (a bp is a hundredth of a percent, so 0.2% lost to buying and selling). That is a net edge of 10 percentage points a year. It is a large number, and the rest of this page is about how it was produced, what you should take off it, and why the list we actually publish has a person in it.
Did it come out ahead?
You want to know whether it worked. That is the only question worth asking about a research product, so here is the straight answer.
Over the full thirteen years, on leak-free point-in-time data (scored only on what was public at the time), yes: 26.2% a year against 16.2% for the blend, and all 114 rolling five-year windows ahead. The S&P 500 on its own returned +420% over the same window against the model's +2,291%, price return, meaning dividends are not counted on either side.
The other half: the stretch we measured out of sample (on years the model was never tuned on), 2022 to September 2026, came back at 29.5% a year against 12.3% for the blend. That is the one window nobody could have fitted to. It was opened once, after the design was fixed, and it stays closed now.
What that buys you is a starting point, not a promise. The years are lumpy, a ten-name book always is, and the limitations section further down is there because you should read it before you decide.
The record
The record
One year tells you almost nothing. Five years tell you a lot.
Calendar year, model minus benchmark
9 of 13 years ahead
- 2013+4.8
- 2014+23.2
- 2015-5.3
- 2016+0.6
- 2017+14.2
- 2018-13.5
- 2019+40.2
- 2020+29.6
- 2021-15.5
- 2022+14.6
- 2023+7.8
- 2024+28.6
- 2025-6.1
Rolling five-year windows
114 of 114 ahead
Results
| Metric | Returnolio Top 10 | Benchmark |
|---|---|---|
| Cumulative | +2,291% | +682% |
| CAGR | 26.2% | 16.2% |
| Rolling 5-year windows ahead | 114 of 114 | 0 of 114 |
| Median 5-year edge | +8 pp/yr | - |
| Calendar years ahead | 9 of 13 | 4 of 13 |
| Out-of-sample stretch, 2022 to Sep 2026 | 29.5% | 12.3% |
| Worst peak-to-trough fall | -40% | -31% |
2019 was the standout, at 76% against 36%, with 2020 at 64% against 34% and 2024 at 55% against 27% close behind. A ten-name book is lumpy by construction, and the model finished ahead of the blend in nine of the thirteen calendar years. The out-of-sample row is the one stretch we measured after the design was fixed. It has its own note under Limitations.
How the test was set up
- Period: January 2013 to September 2026
- Benchmark: 50/50 S&P 500 / Nasdaq-100 blend, price return
- Strategy: 10 names, equal weight, reviewed monthly: seven from the score, up to three riding market momentum when conditions favor it
- Costs: 20 bps round trip
- Margin, shorts, derivatives: none
- Dividends: excluded, on every series
- Measured: 9 October 2026, on the data as it stood on 9 October 2026. The run and the data it read are kept together, so the same number can be produced again later
The model is the floor. The review is the product.
We keep developing and backtesting our models, and we will keep doing it. The machinery on this page is a research program, not a finished object: the scoring gets measured again, the data behind it gets corrected every week, and when a design beats the one before it on a test that was sealed in advance, it replaces it. That is how the number above was produced, and the run and the data it read are kept together so it can be produced again.
What we will not automate is the last step. The model reads financial statements, and financial statements are always a quarter behind the world. So every monthly list is read by a person, name by name, with the filings open, and here is what that person does that the model cannot.
The macro picture is read by a person, not a feed. Every month starts with the state of the world: what the Federal Reserve did, what the yield curve is saying, what the Trump administration has put a tariff on this time, and who pays for it. The model has no column for any of that. In September the person reading the list found that Deckers, the company behind HOKA and UGG, is paying about 150 million dollars of tariffs this year and expects to recover roughly half of it. That is on the card, in those words. The score would have found out in about a quarter.
Where the growth came from is read by a person. In August the list held AngloGold Ashanti on a year that changed the company: revenue up from 5.8 to 9.9 billion dollars, profit tripled. A person read the same accounts and saw what had tripled it, which was the gold price. We do not forecast the gold price and have no advantage in trying, so we sold the winner, up 45.8% since June, and said why. A model cannot tell the difference between a company that got better and a company whose product got dearer.
Who is running the company is checked by a person. In September the model liked Adobe, and the person reading the list found that its chief executive had told the board in March that he would leave once a successor was named, that six months later there was none, and that the finance chief had resigned in June for Marvell, leaving an interim in the seat. A 25 billion dollar buyback being spent by two people on their way out is a risk, and it is written on the card as one. No filing says "interim".
Two guidance cuts in a year are noticed by a person. A. O. Smith passes our financial-health checks comfortably and earns a 30% return on capital, because nobody postpones replacing a broken water heater. It also cut its guidance twice in 2026 while its China sales fell sharply. The score still cleared. The person put it on watch in August, said so in print a month before acting, and named the condition: if China has not stabilised by the next list, it is the first cut.
Then that person has to write down why each name is there, on the list you receive, and the list is marked against the market every day afterwards.
The live list is a real portfolio, not a paper one. The aim we set is to be ahead of the market average over five-year stretches, and the way we earn the right to say that is to publish every month we are not, next to the months we are. The losing years above are here. The live list on the home page is marked every day. Neither is edited afterwards.
What the model actually does
The backtest is a strict, mechanical simulation of one rule:
Hold ten stocks from the universe, equal-weighted. Review monthly. Swap a holding only when a challenger outscores it by a clear conviction margin. No exceptions.
That is the full strategy. No discretionary overrides, no position sizing beyond equal weight, no borrowed money, no short side. The conviction margin keeps turnover low, so most months most of the book does not move. No more than four of the ten may come from one sector, because ten semiconductor names in a good year for semiconductors is one bet with ten tickers on it.
The published Top 10 is not exactly this
The rule above is what was tested, and it is mechanical on purpose. A backtest with human judgement inside it cannot be argued with: whatever it returns can be explained afterwards by the judgement, so it proves nothing about the model. Taking the judgement out is what makes the number mean something.
The Monthly Top 10 that goes out to subscribers is that rule plus the review step described above, and names do get corrected out of the list by hand.
The clearest case is news that is already in the price. A company announces something good, the market moves that day, and the model is left looking at a new price next to financial statements that have not caught up yet. They probably will. That is precisely what makes it a poor entry now, and the model has no way to see it, because the thing it would need to see has not been filed. A person can.
So the 26.2% belongs to the mechanical rule, not to the published list. The list has a shorter history, a person in it, and every holding disclosed on the day it is held. Whether the review step earns its place is not something you have to take on trust: it is in front of you, every month, next to the score that would have run without it.
The universe
973 companies across the US, the UK and Canada, each required to carry enough fundamental history for the inputs to be well defined, up to ten years of quarterly financials where it exists. REITs (real estate investment trusts) and alternative asset managers are excluded from the Top 10 because their financial structure does not translate cleanly to the economic-profit model. They stay visible on their own pages.
The same reading on every company
Every company in the universe is measured the same way, every month, and every pillar behind its score is shown on its page: how durable the business is, whether it earns above the full cost of its capital, whether the price is sane for the growth you are buying, whether the market has started agreeing with the fundamentals, and what insiders are doing about it.
RTEP is ours. Returnolio True Economic Profit is a measure we built rather than borrowed, because the standard ones flatter the wrong companies. It charges a business for every dollar of capital it uses at what that capital actually costs, and it treats research spending as the asset it is instead of a cost that vanishes the year it is spent. A company can grow earnings for a decade and create nothing. RTEP is how we tell those apart.
How they come together into one number is the part we keep to ourselves. The pillars are published, the sub-metrics behind each are published, and every value is on the page for you to argue with. Which of them carry weight, how much, and how they combine is not.
Moonshot Detected Companies
Since the October 2026 edition, up to three of the monthly ten are momentum picks, Moonshot Detected Companies: names with strong, sustained market momentum that pass the same safety filters as every other candidate, included when market conditions favor them by our internal reading of the macro environment. They are badged on the list so the two kinds of conviction never blur. The momentum measure and the conditions rule stay internal, like the rest of the recipe.
Why point-in-time matters
The single most common way backtests lie is look-ahead leak: the model is given data on date T that was not actually known until T+90 or later.
It is marking last week's exam with this week's answer sheet. The grade comes out great, and it measures nothing.
- Quarterly earnings are reported 45 to 90 days late. A backtest that uses Q1 numbers on April 1 is cheating.
- Companies restate prior quarters. A backtest built on as-restated numbers is using information nobody had at the time.
- A backtest run against today's index membership is survivorship-biased by construction: the companies that died never sit the exam.
The Returnolio backtest uses a true point-in-time scoring engine. Every monthly portfolio is built using only the data available on the first trading day of that month, with the right ingestion lag applied to each source.
Since July 2026 the engine anchors each annual report to its actual SEC filing date rather than a calendar approximation. 12,038 filing dates were backfilled directly from EDGAR, with the source of each row recorded. Where the only available date comes from a later comparative filing and would imply a lag over 365 days, the row stays on the older, conservative fallback rather than an implausible date.
This is also why our published edge is smaller than our first run suggested. When we built the model without this rigor the number was much higher. Most of that turned out to be leak. We rebuilt the engine and ship only what survives it.
Limitations
A backtest is a simulation, not a track record. These are the limits of this one.
- Survivorship bias. The universe is the present-day large and mid-cap list. Companies that went bankrupt or faded out of it are absent, which raises backtested returns on both sides and likely the strategy's more.
- Out of sample, on one window, the edge is not proven. Everything from 2022 on was sealed off before the September 2026 design work began and opened once, at the end, for the chosen design only. That window came back at 29.5% a year against 12.3% for the blend. One window is one window, and a single stretch can move a long way.
- The record moves with the data. The corrections that flow into our financial statements every week change past scores, and past scores change which names the simulation held. Every figure on this page carries its measurement date for that reason, and we keep the data each run read.
- Momentum names are the most exposed to survivorship. The universe is today's list, so a momentum pick from 2020 was drawn from names that are still here in 2026. Deleting winners at random from the candidate set left the September design ahead of its own baseline, but the momentum slots are the part of the record we trust least on this point.
- Costs, taxes and behaviour. Trading costs are modelled at 20 bps round trip and real execution can cost more. Tax on realised gains is non-trivial, and investor behaviour under drawdown (the stretch where your account sits below its old high) is the largest hidden tax of all.
- Dividends are excluded on both sides. The model's holdings actually yield slightly more than the blend, so if anything this understates it, but the published figures are price returns.
- A few years carry a lot. 2019 and 2020 together account for a large share of the full-period edge, and 2020 is the momentum slots in the COVID rebound. Concentrated books are lumpy and the average year looks nothing like the average.
- Regime risk. The period covers a long bull market, the COVID crash and the 2022 bear. It does not include 1970s-style stagflation, Japan-style deflation, or a 2008-scale financial crisis. The model is not trained on those.
- Monthly resolution in what we publish. The series we ship is monthly, so intra-month drawdowns are not visible in it.
- Coverage scope. US, UK and Canada today. Expanding the universe will require retraining and revalidating, and the published numbers may change.
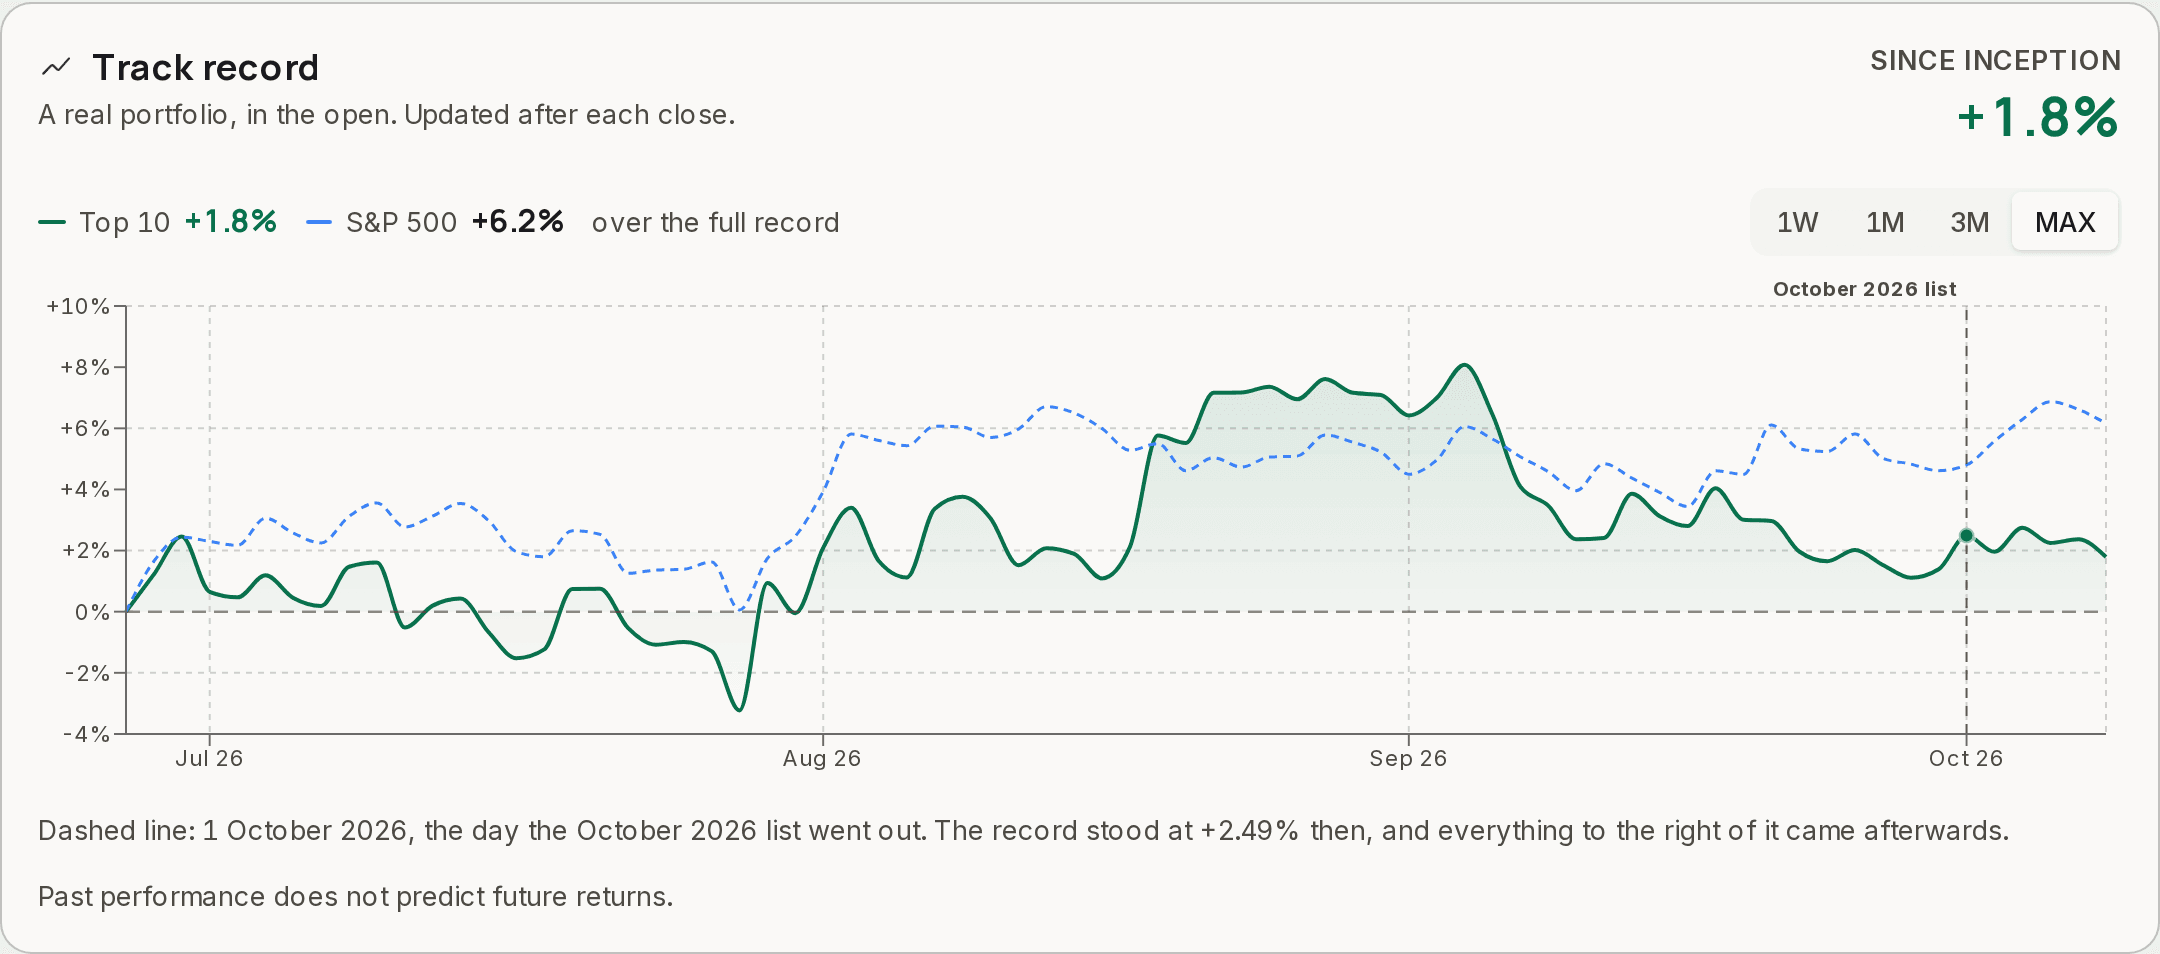
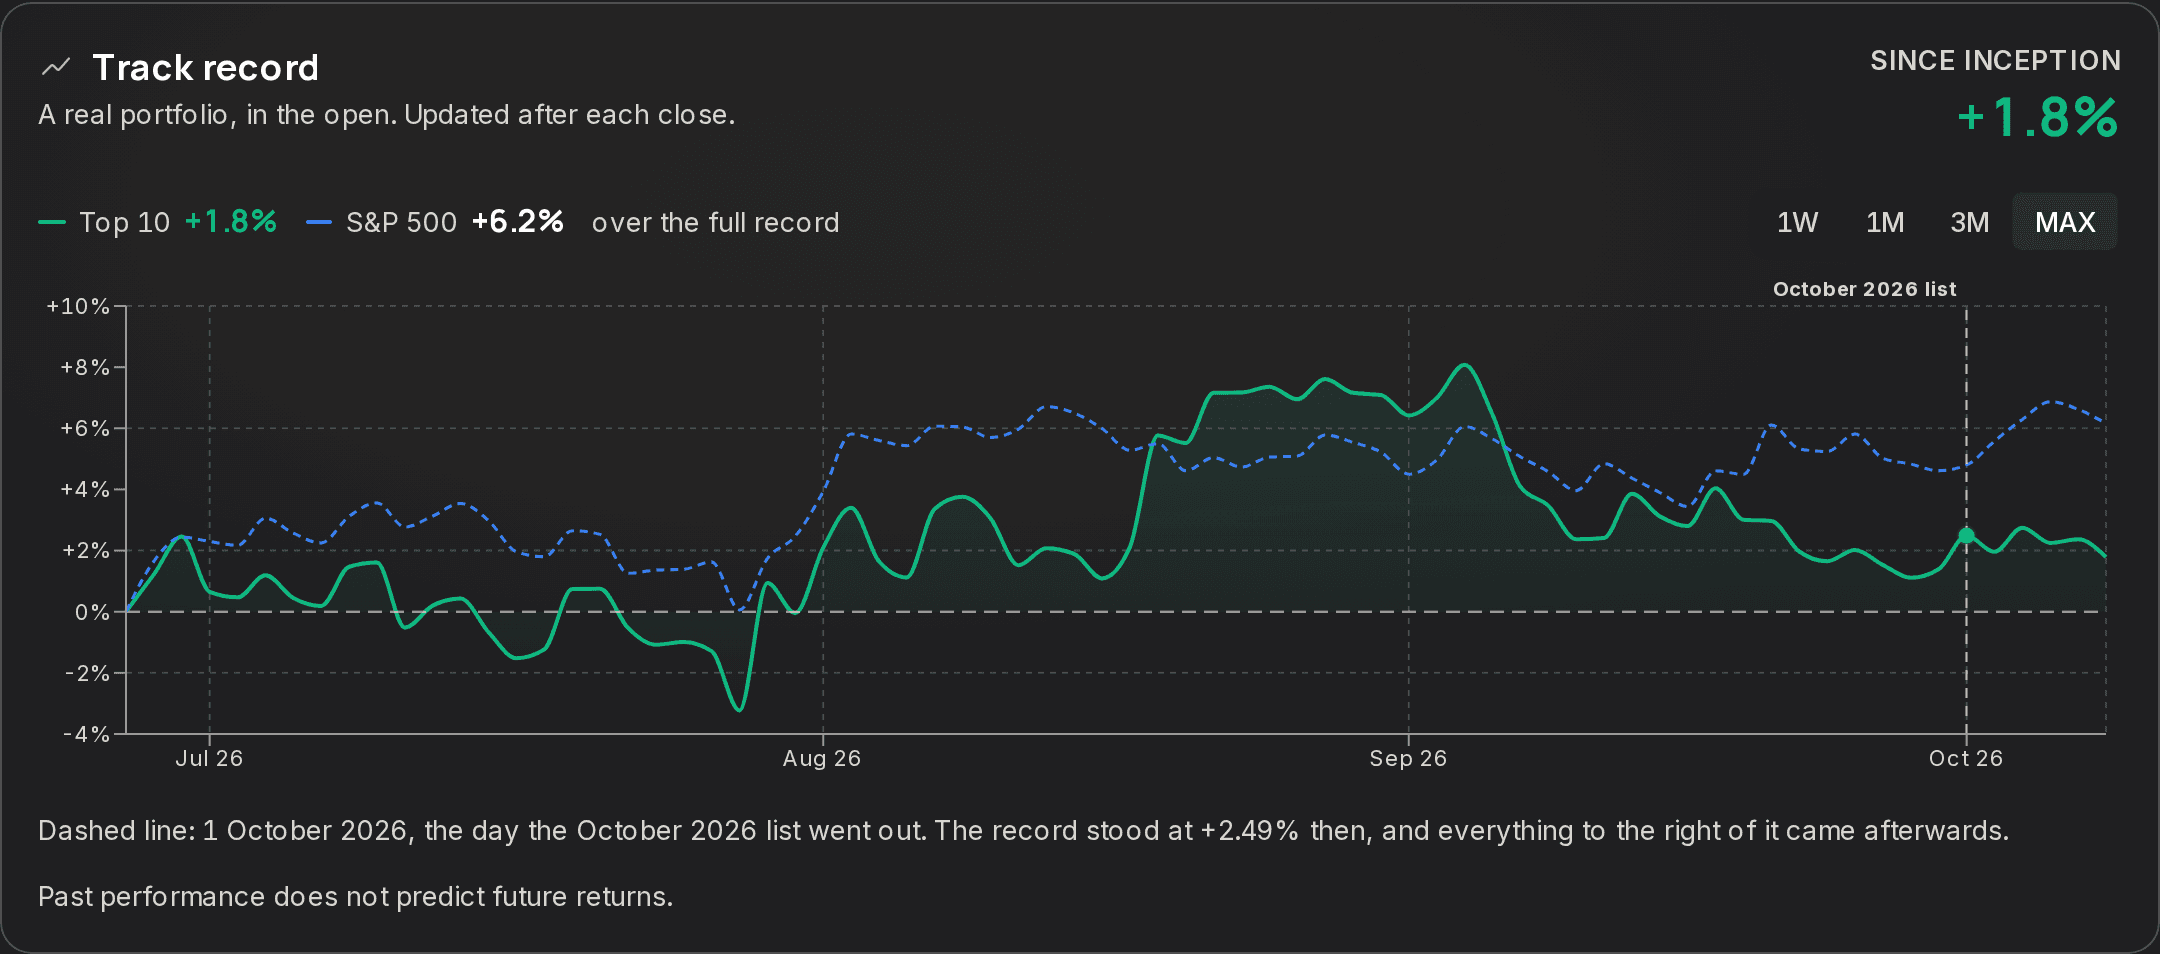
- The live record is months old, not years. The live portfolio started in June 2026 and we publish how it is doing next to the S&P 500 on the home page. Months of live data settle nothing either way, but it is the only number here that cannot be produced again after the fact.
On the page
Every one of these is visible to you
- Every calendar year, including the four the model lost
- The sealed 2022-onward hold-out, opened once for the chosen design
- That single years are noisy, and which ones went the other way
- That the published list has a review step the backtest does not, and what that step is for
- The costs modelled, and what was excluded on both sides
Kept internal
Named, so you know what you are not seeing
- The blend the tested model used
- The thresholds and cut-offs inside each pillar
The work behind the number
- 13
- years tested, point-in-time
- 12,038
- filing dates pulled from EDGAR
- 973
- companies re-scored every month
- 0
- manual overrides in the test
Point-in-time to the day each filing reached the SEC, so the model never sees a number before the market did.
Common questions
What is a point-in-time backtest?
One that scores each month using only the data that was public that month. Returnolio dates every earnings figure to the day the filing actually reached the SEC rather than to the quarter it covers, which is a stricter test than a calendar approximation.
What is look-ahead bias?
Letting a test see information that did not exist yet. It is the most common way a backtest flatters a model, because a figure filed in March gets applied to January and the model appears to have known something nobody knew.
Why publish the years the model lost?
Because a result with the bad years removed is not a result. The model was behind the passive blend in four of the thirteen calendar years, and a reader who cannot see that cannot judge any of the rest.
Why is there a person between the model and the list?
Because the model reads financial statements and nothing else. An officer leaving, an interim in the finance seat, a price that already contains next quarter's news: none of that is in a filing yet, so no scoring model can see it. Someone reads every name with the filings open before the list goes out, and writes down why each one is there.
We backtested thirteen years and published every losing year. Then we put a person between the model and the list, because the model cannot read the news.
The disclaimer (full version)
Backtest results are based on real historical market data, point-in-time, with a sealed hold-out that stayed locked throughout tuning and was opened once for the chosen design. We use the regulatory term hypothetical in formal contexts because no money was actually invested during the test period. The underlying data, prices and fundamentals are real, and were available on the dates the model used them.
Returnolio provides educational and informational content. Nothing on this platform is personalised investment advice. Backtested results, including model-portfolio results, are not a guarantee of future returns. All investing involves risk, including the possible loss of principal. Consult a qualified financial advisor before making investment decisions.
Was this page helpful?