Returnolio

Stock research

Stock research that does the work, then shows you the working.

We read the filings of 973 listed companies every week and draw what matters: what a business really earns, what it is worth, and whether its managers do what they said they would.

What you get, in six pictures.

01

Profit, after the rent on capital.

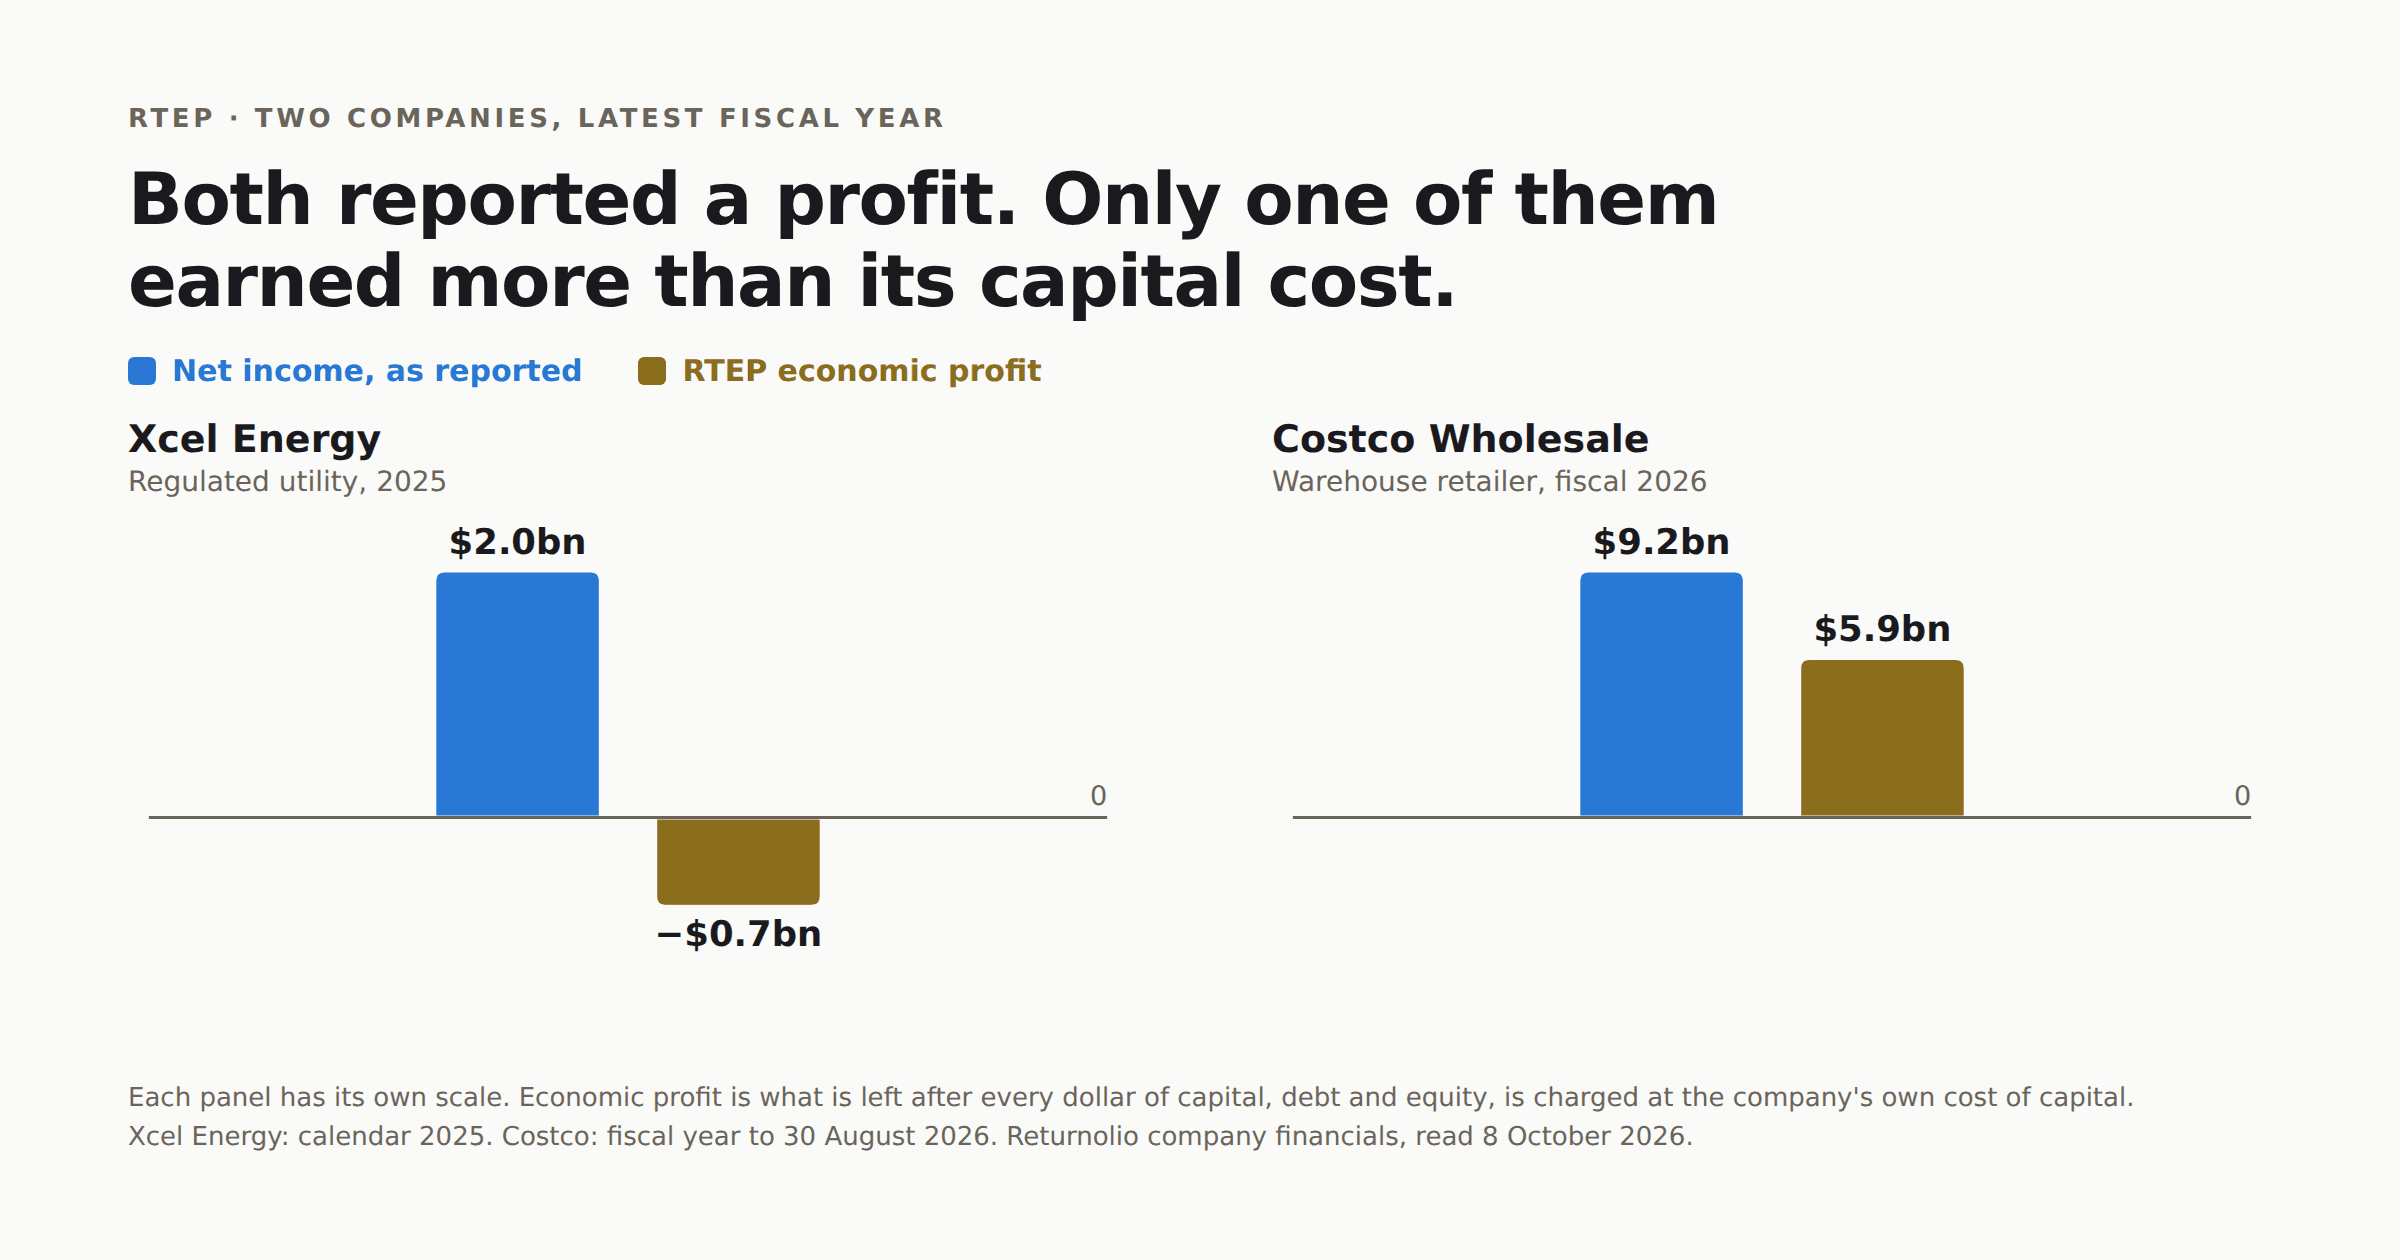
RTEP is our own measure of economic profit: it charges every company the full cost of the money it uses and treats R&D as the investment it is, so a company can report a profit and still show up destroying value.

How RTEP works
Two companies, latest fiscal year: Xcel Energy reported $2.0bn of net income and an RTEP economic profit of minus $0.7bn; Costco reported $9.2bn and an economic profit of $5.9bn. Returnolio company financials, read 8 October 2026.

02

Ten companies a month, written up in full.

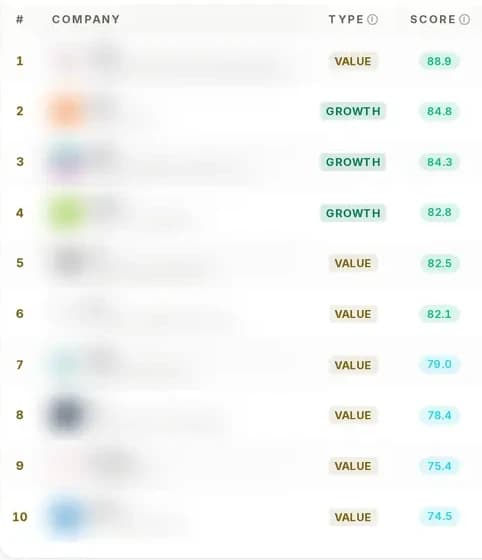
Every month the Top 10 edition gives the thesis, the risks named and every change explained, with our positions disclosed and a live track record.

How the Top 10 works
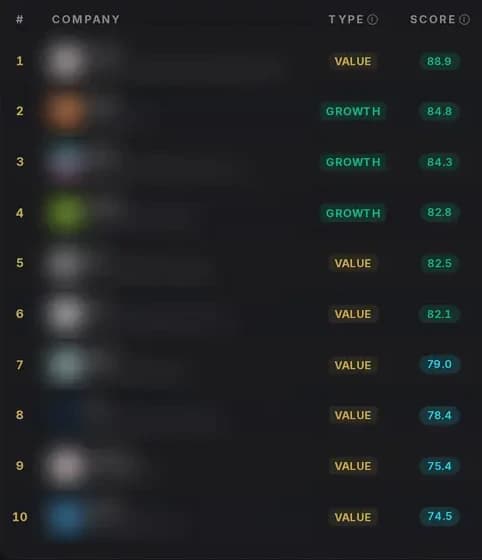
The Top 10 list in the app: ten ranked companies with their type and score. Company names are blurred, because the list is for members.

03

A model tested before we trusted it.

The score behind the Top 10 was tested on thirteen years of point-in-time data, using only what was public on each date, and the whole backtest is on the site.

Read the backtest
The Returnolio Score for Amazon: a 0 to 100 reading in the middle of a radar, with the five pillars listed under it.

04

Fair value, drawn against the price.

Up to four valuation methods, chosen by business model, plotted against the share price, so you see where it sits today and where it sat in the last downturn.

The fair value methods
The valuation chart on a ticker page: two fair-value lines against the share price, with recessions shaded and splits marked.

05

Did management keep its word?

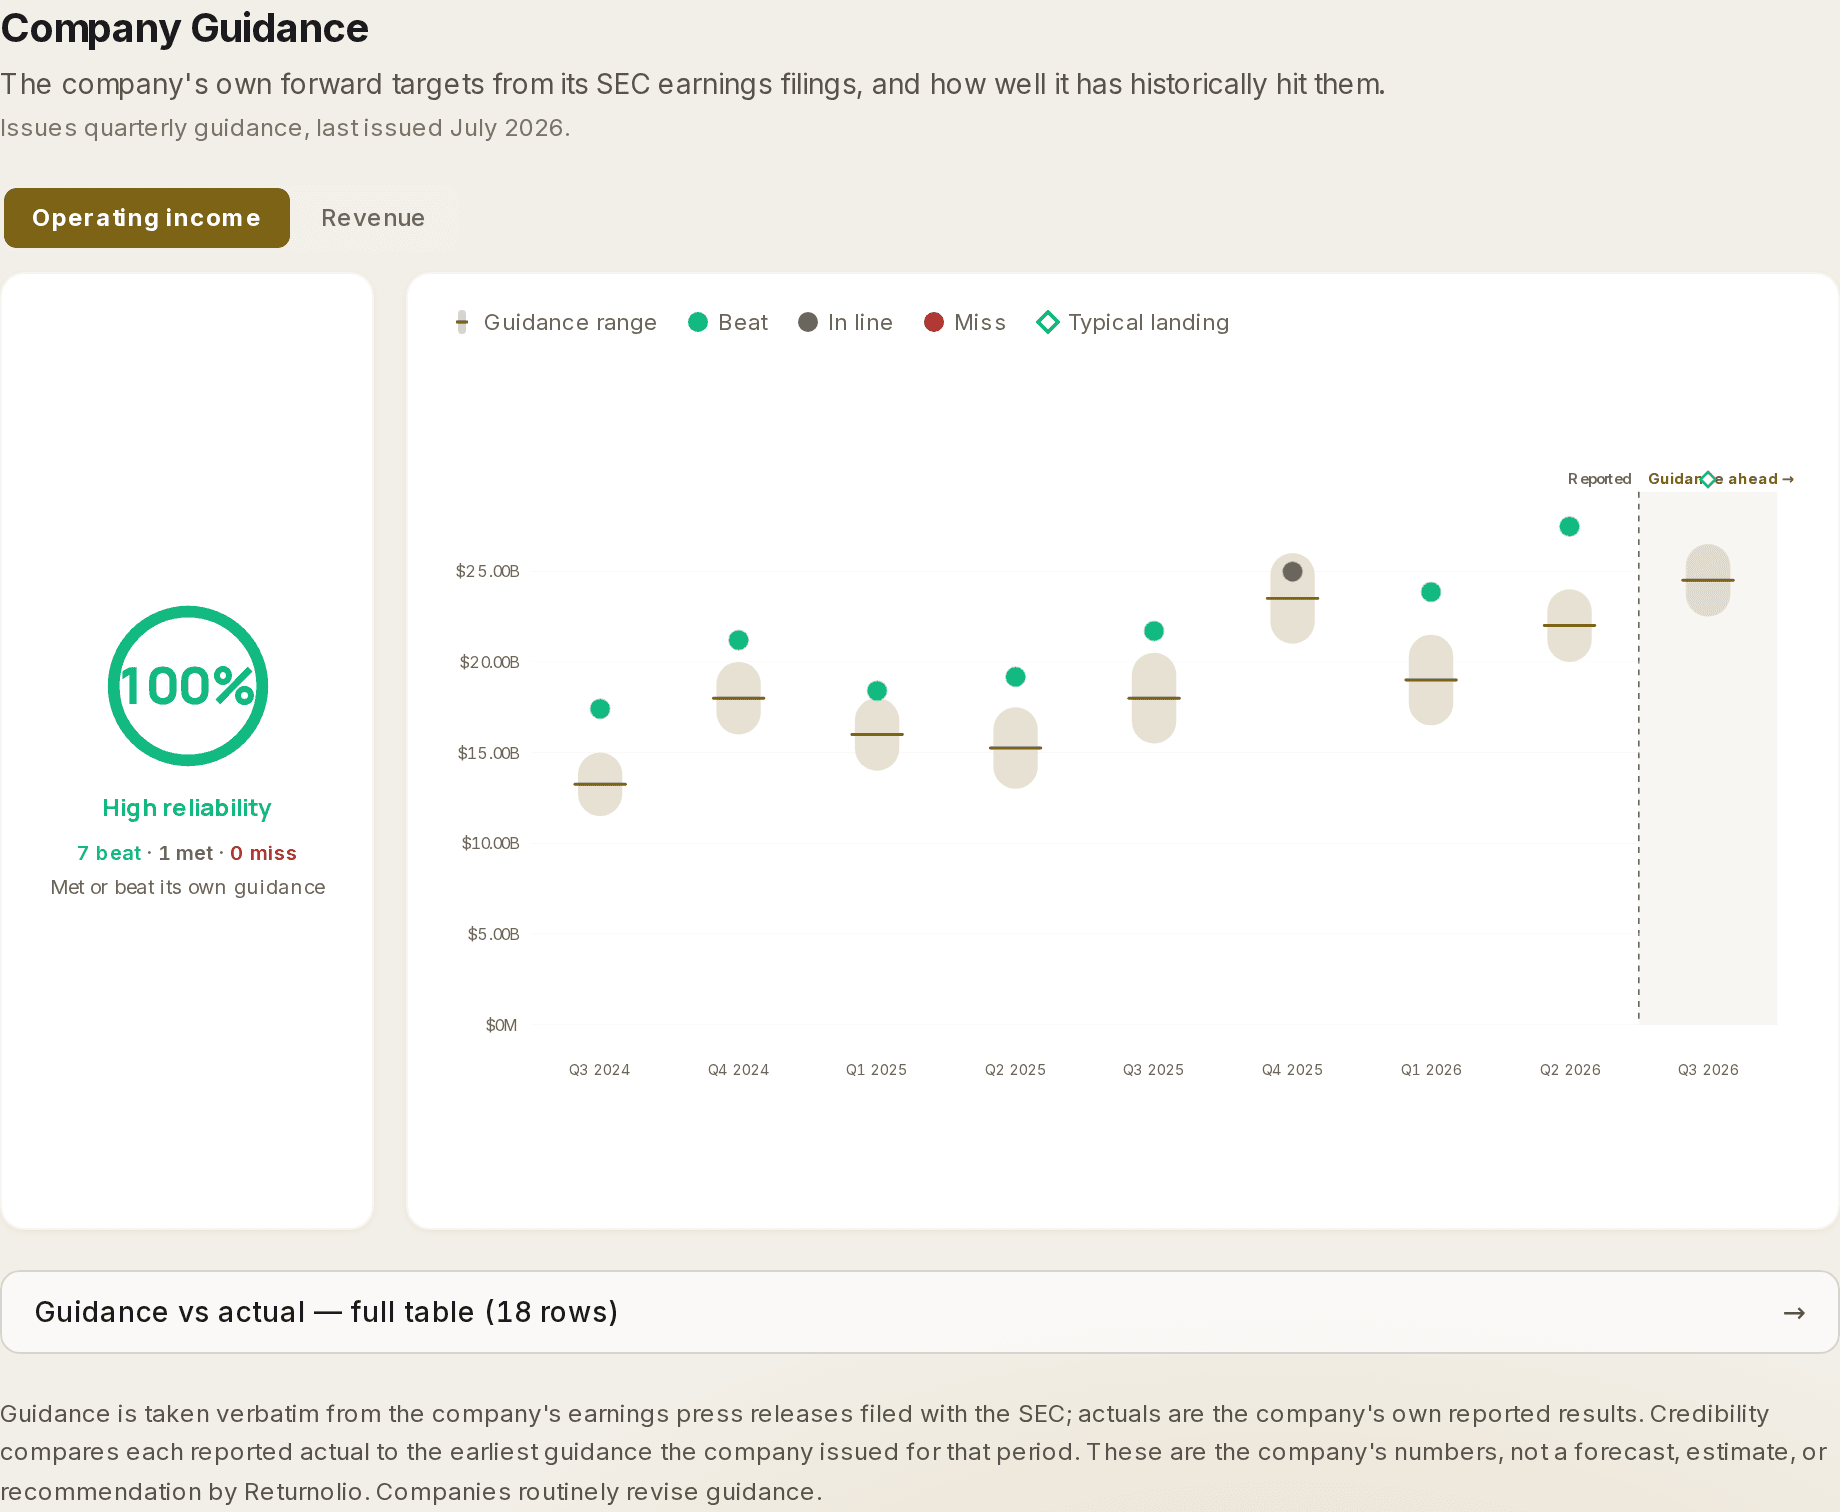
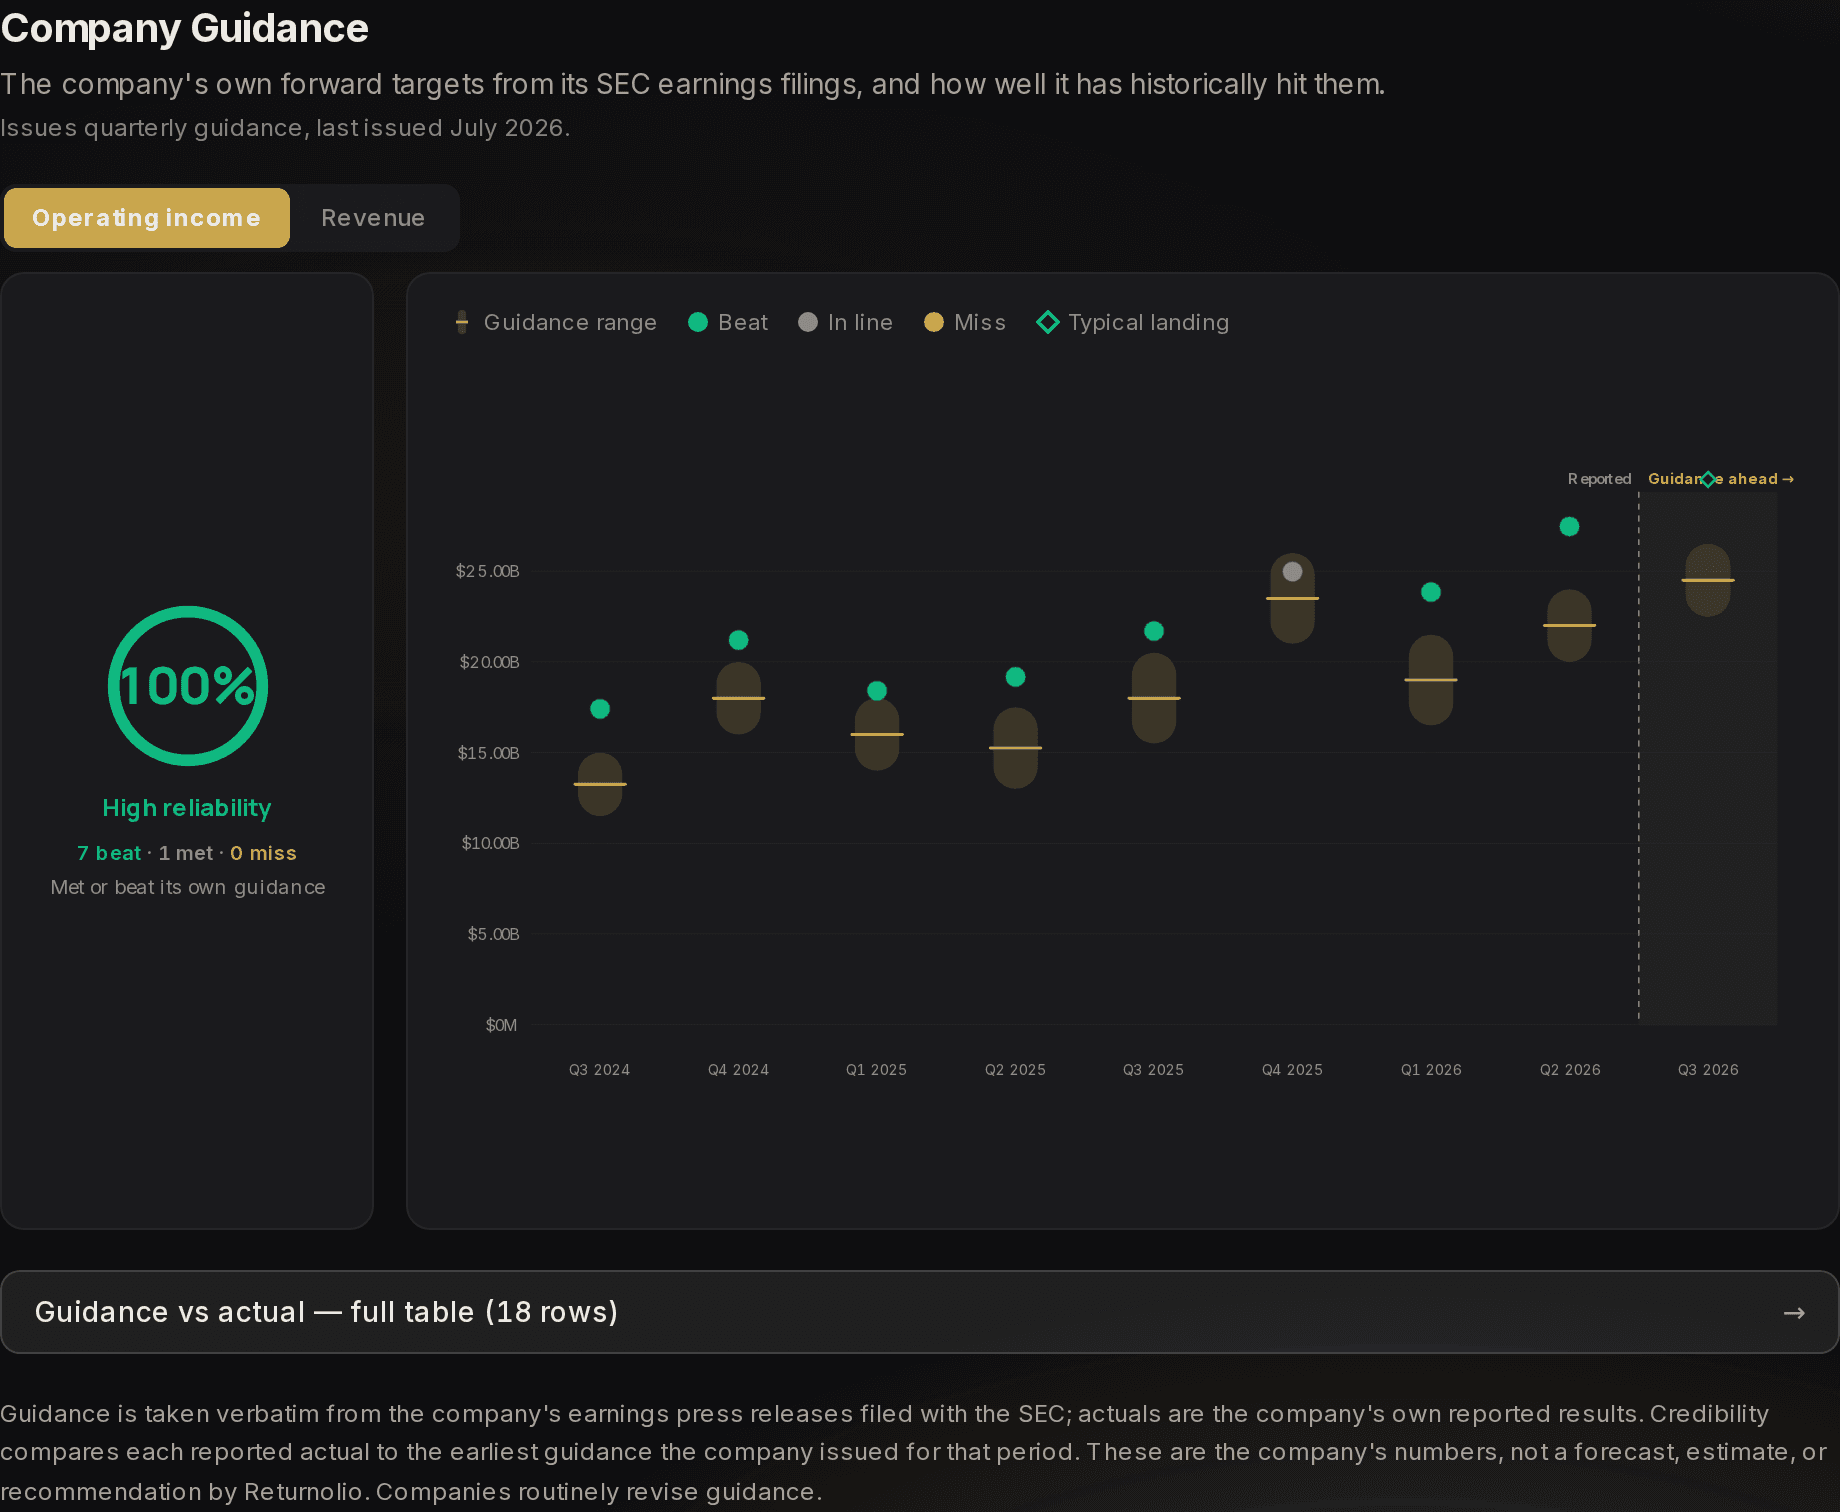
Each quarter's guidance range is drawn against what the company then reported, and a reliability dial counts the beats, the meets and the misses.

Company guidance, explained
The Company Guidance section: a reliability dial with counts of beats, meets and misses, and a chart of each quarter's guidance range against the reported result.

06

Read it in a glance, check it in a click.

The score, the radar and the charts tell the story first, and every number opens into the inputs behind it.

Tour the ticker page
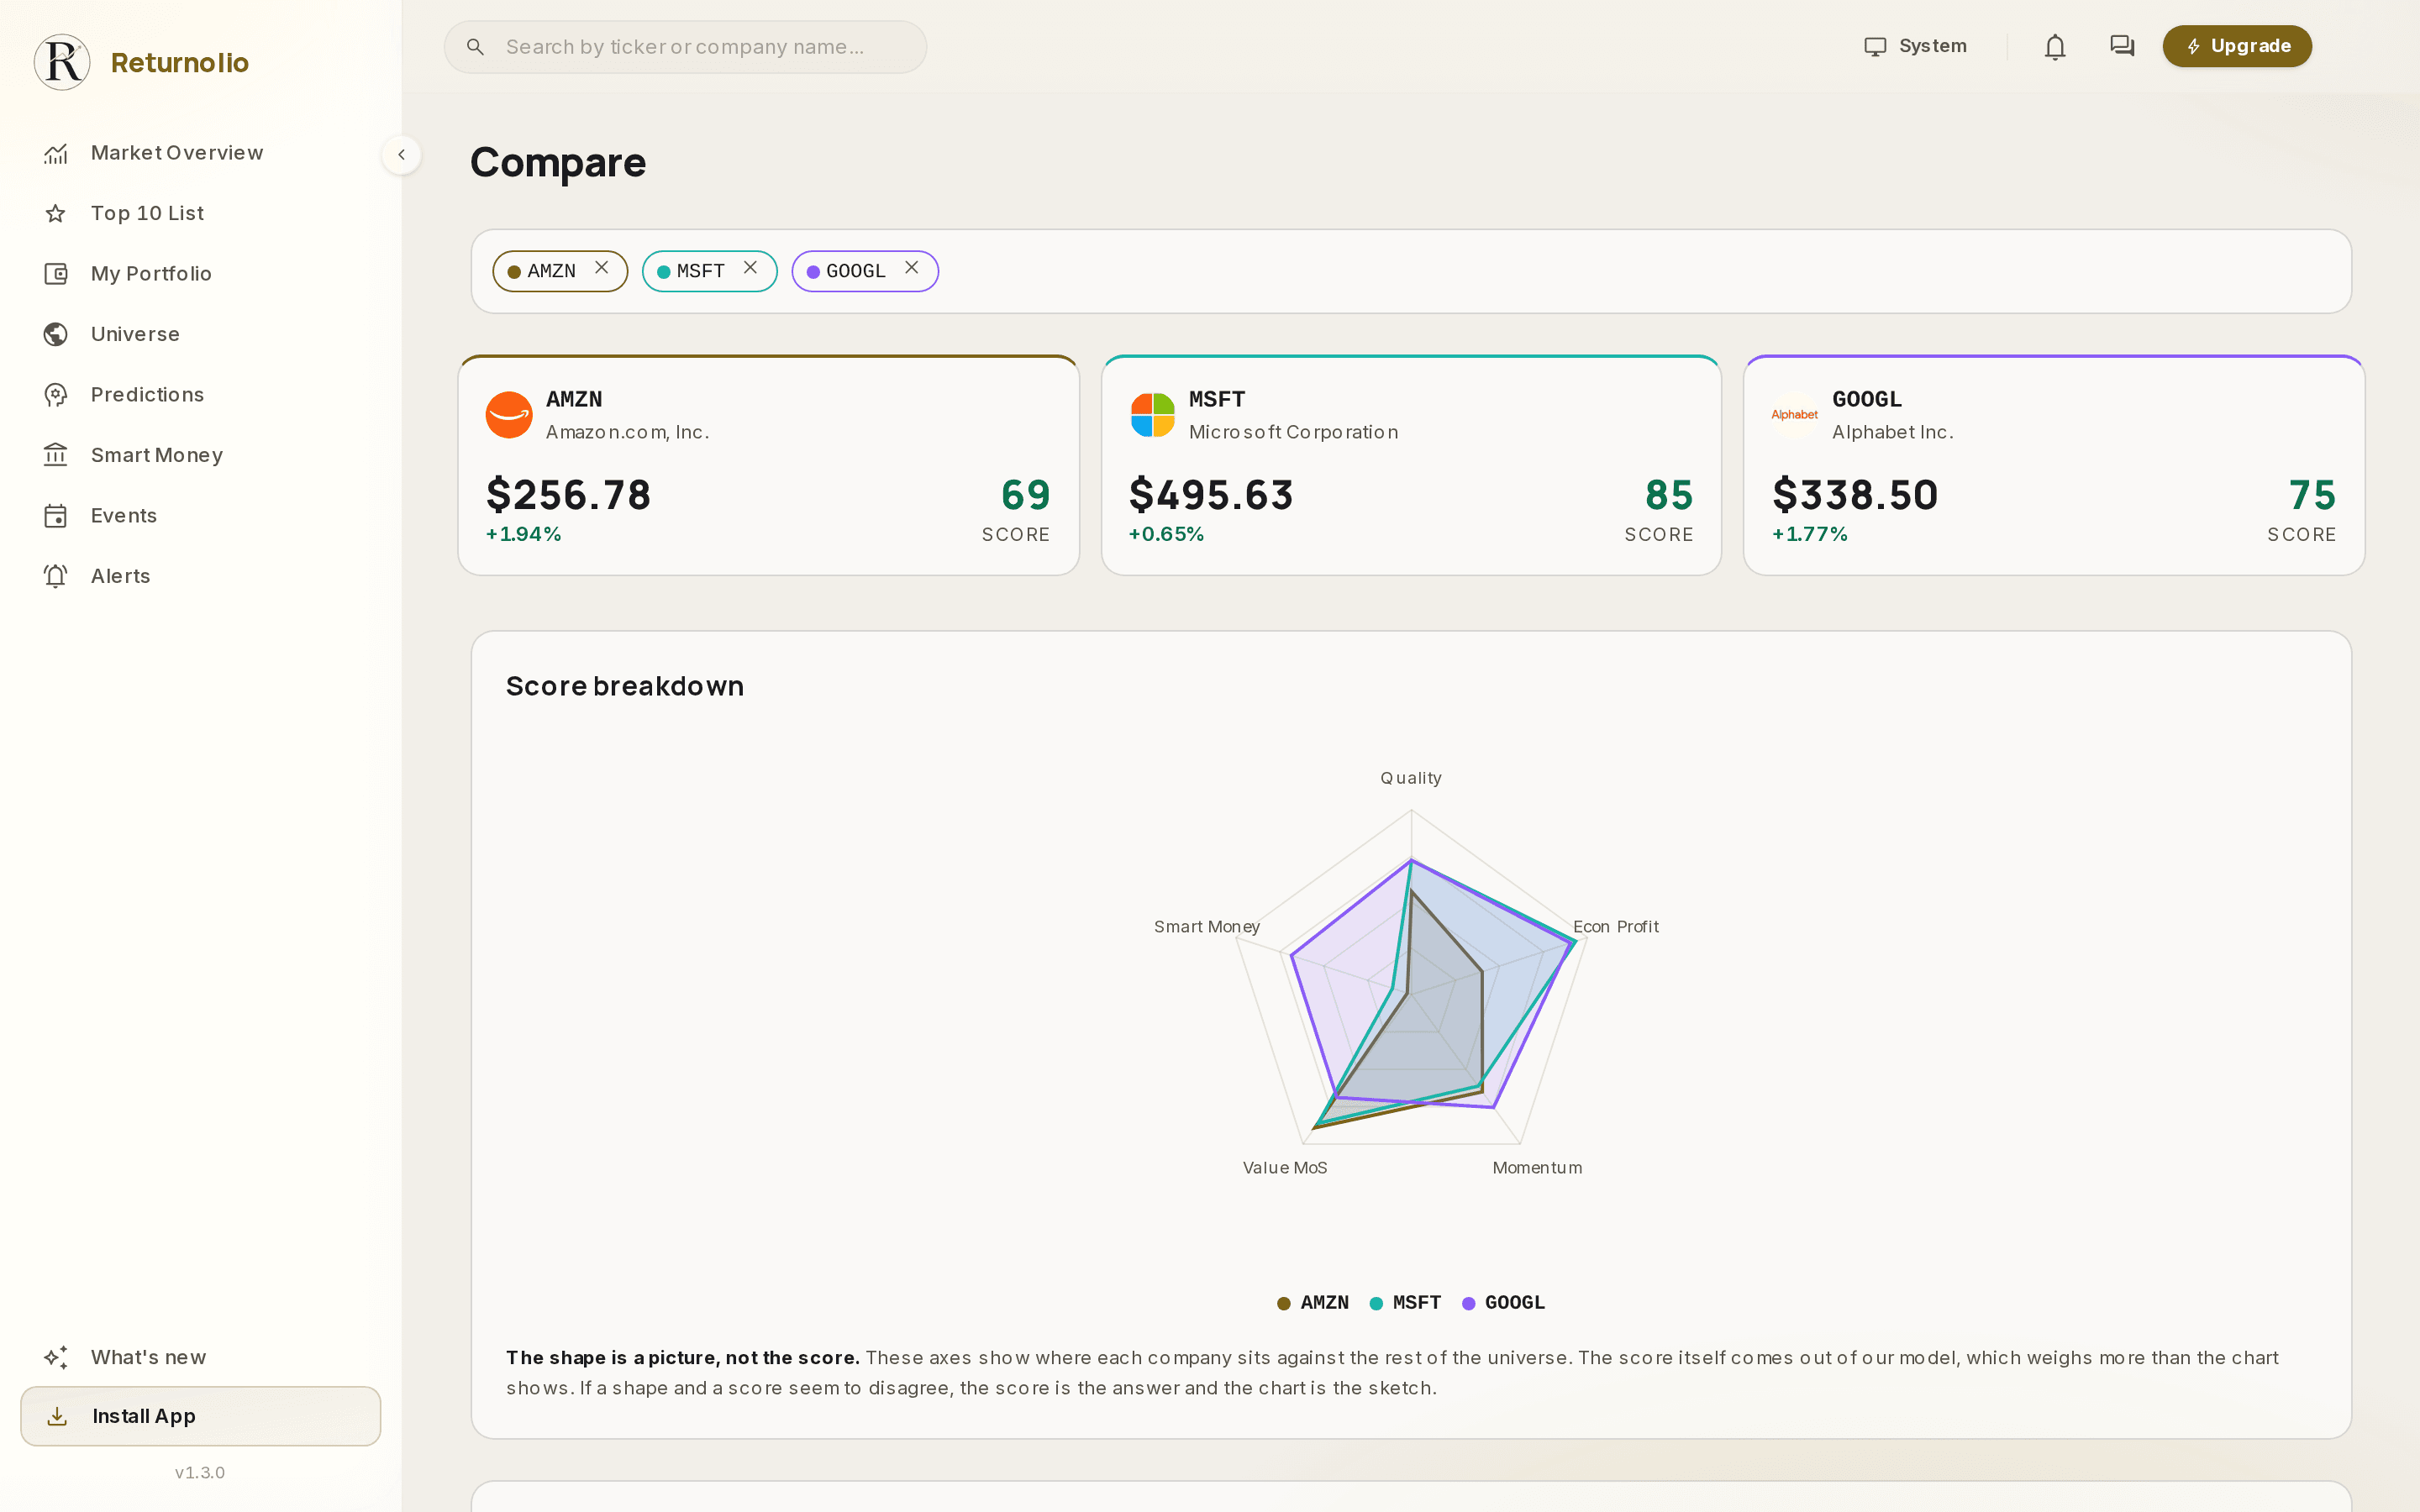
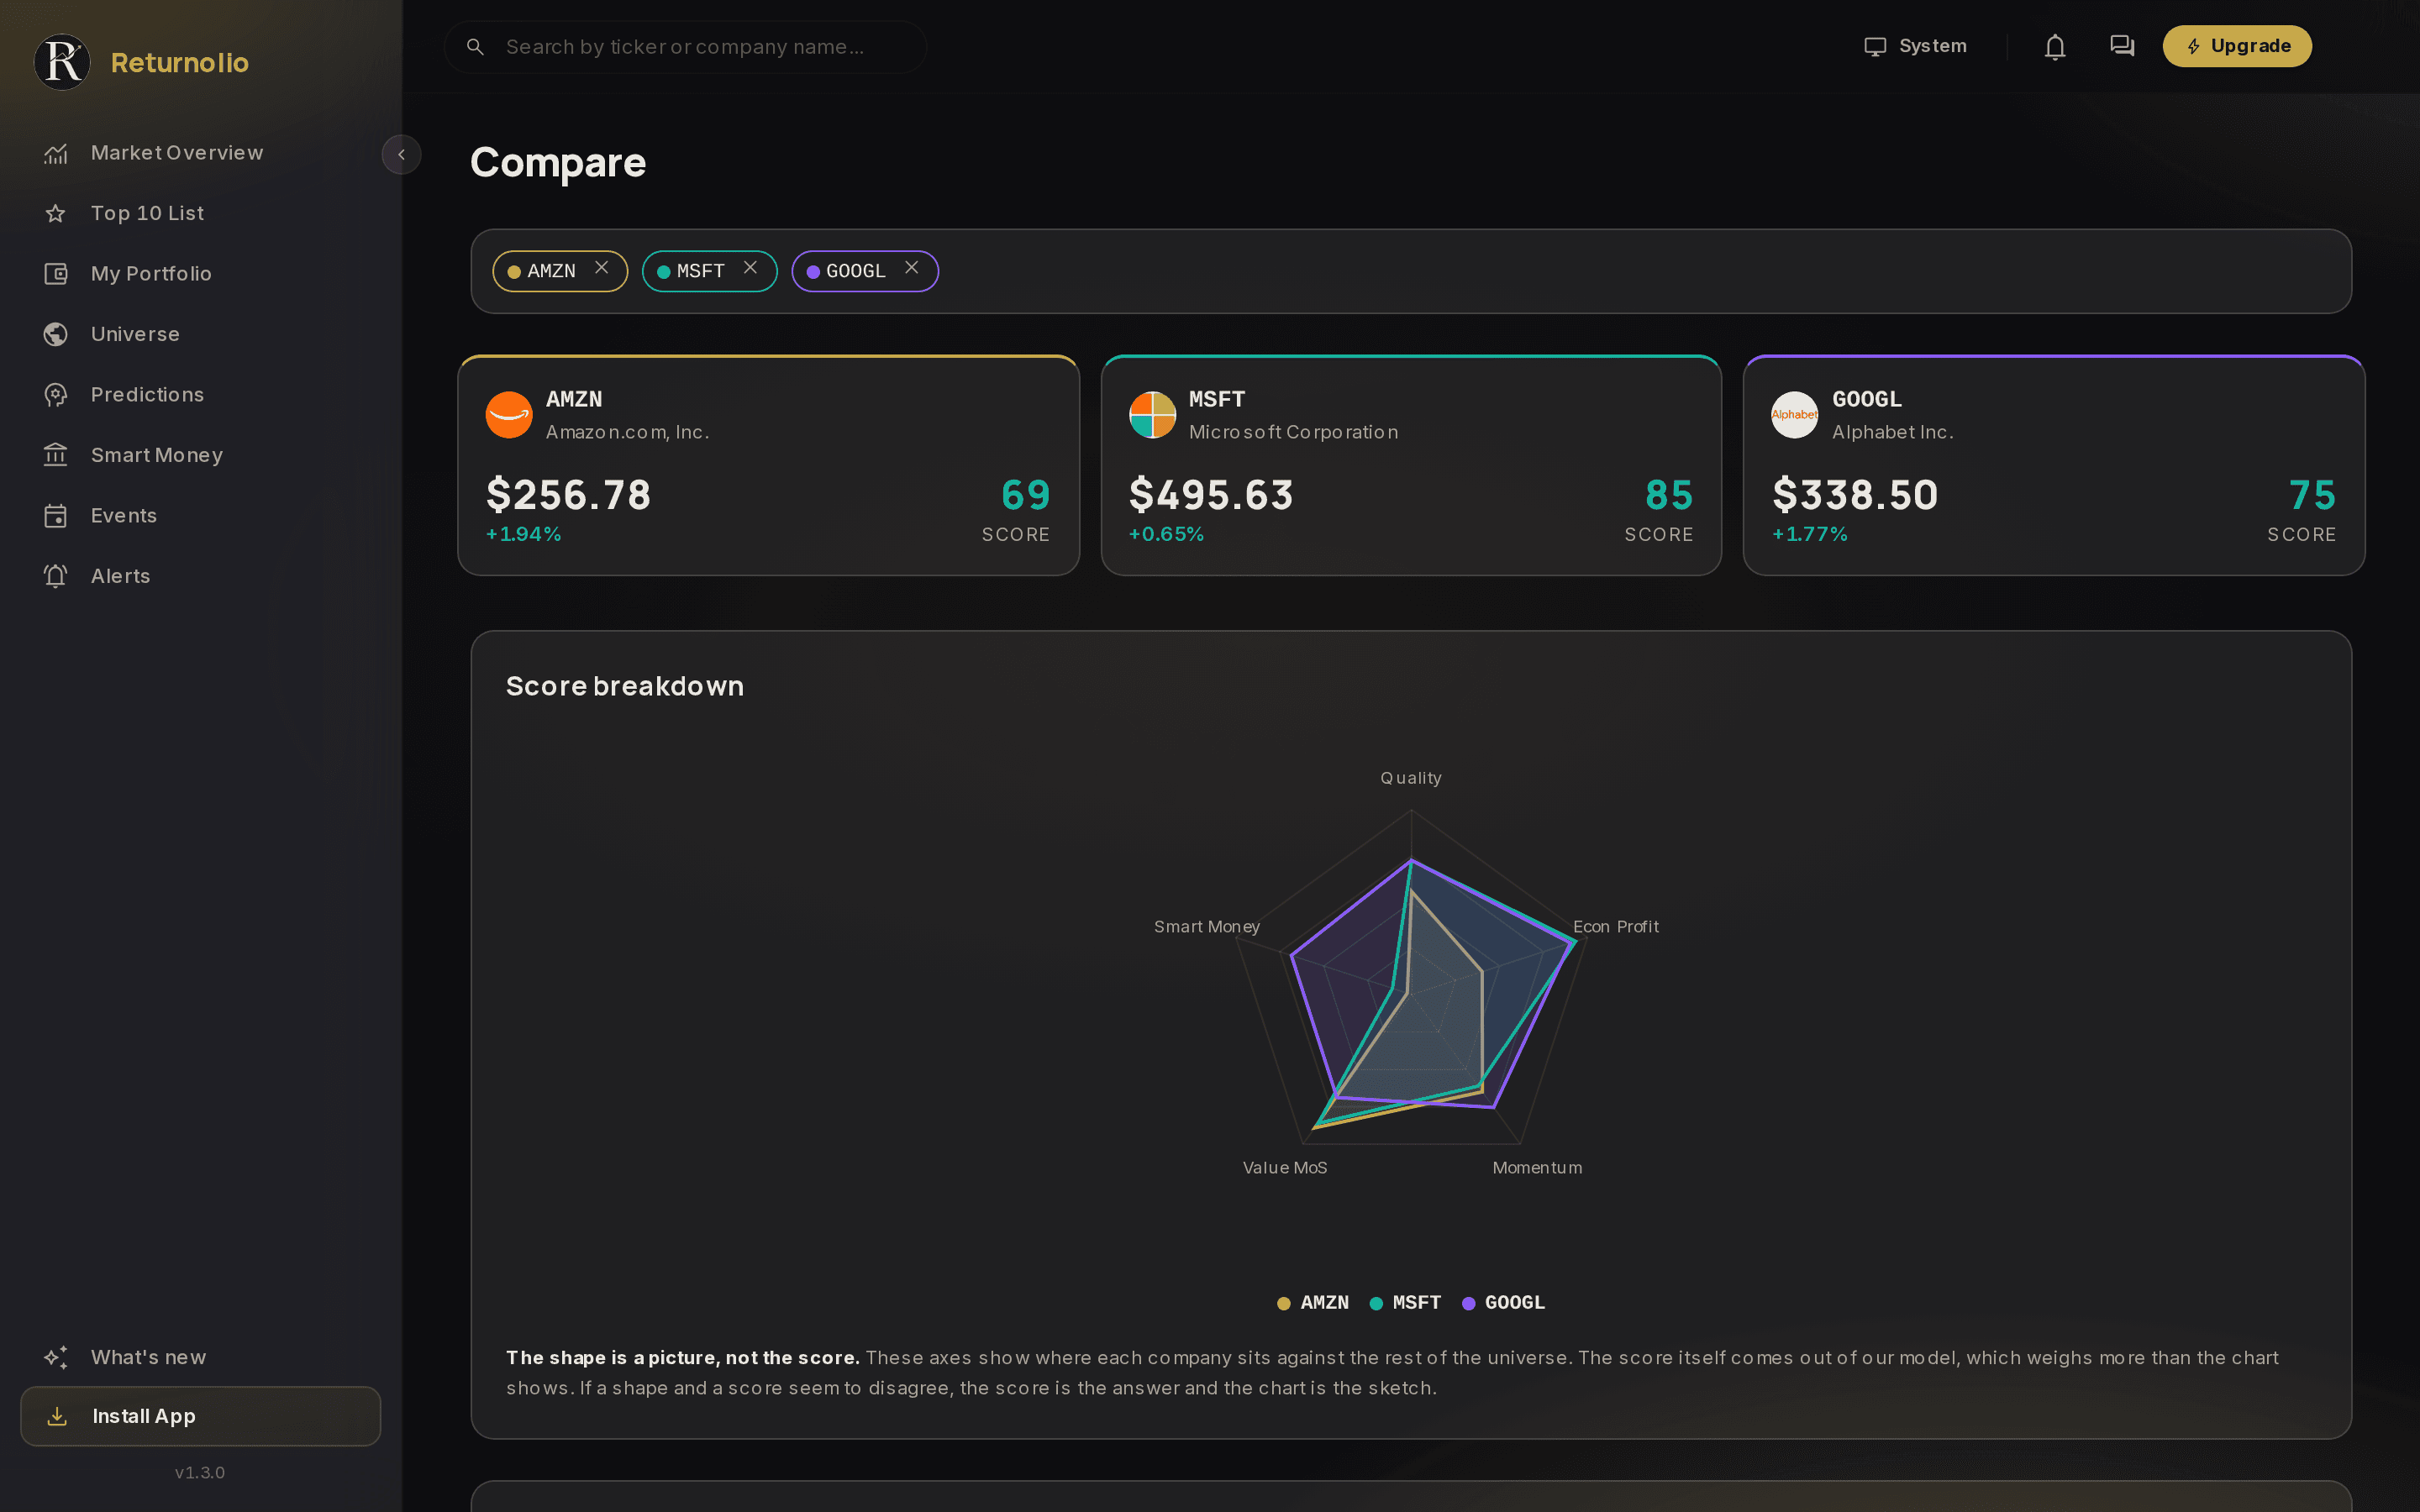
The Compare screen with Amazon, Microsoft and Alphabet: one radar, one colour per company, each axis a pillar.

The short version.

Coverage
973 listed companies, re-scored every week.
Tested on
Thirteen years of point-in-time data, dated to the day each filing reached the public.
Plans
From $9 a month, billed yearly. Every plan.

Do the homework the fast way.

Serious investors read the numbers every quarter. The ones who skip them buy stories. We do the reading for every company and every filing, and draw it so the line that matters jumps out.

Join now