

How the Top 10 is chosen, and by whom
The score ranks the universe. It does not choose the list. These are the rules that turn a ranking into the ten companies we write up, and hold, each month.
Last updated October 12, 2026


The Returnolio score sorts around a thousand companies. Take the top ten rows, call them a portfolio, and you would own a bad one. So we do not.
A ranking answers "which is best". A portfolio has to answer "what do we own now, what do we sell, and how wrong can one mistake go". Those are different questions.
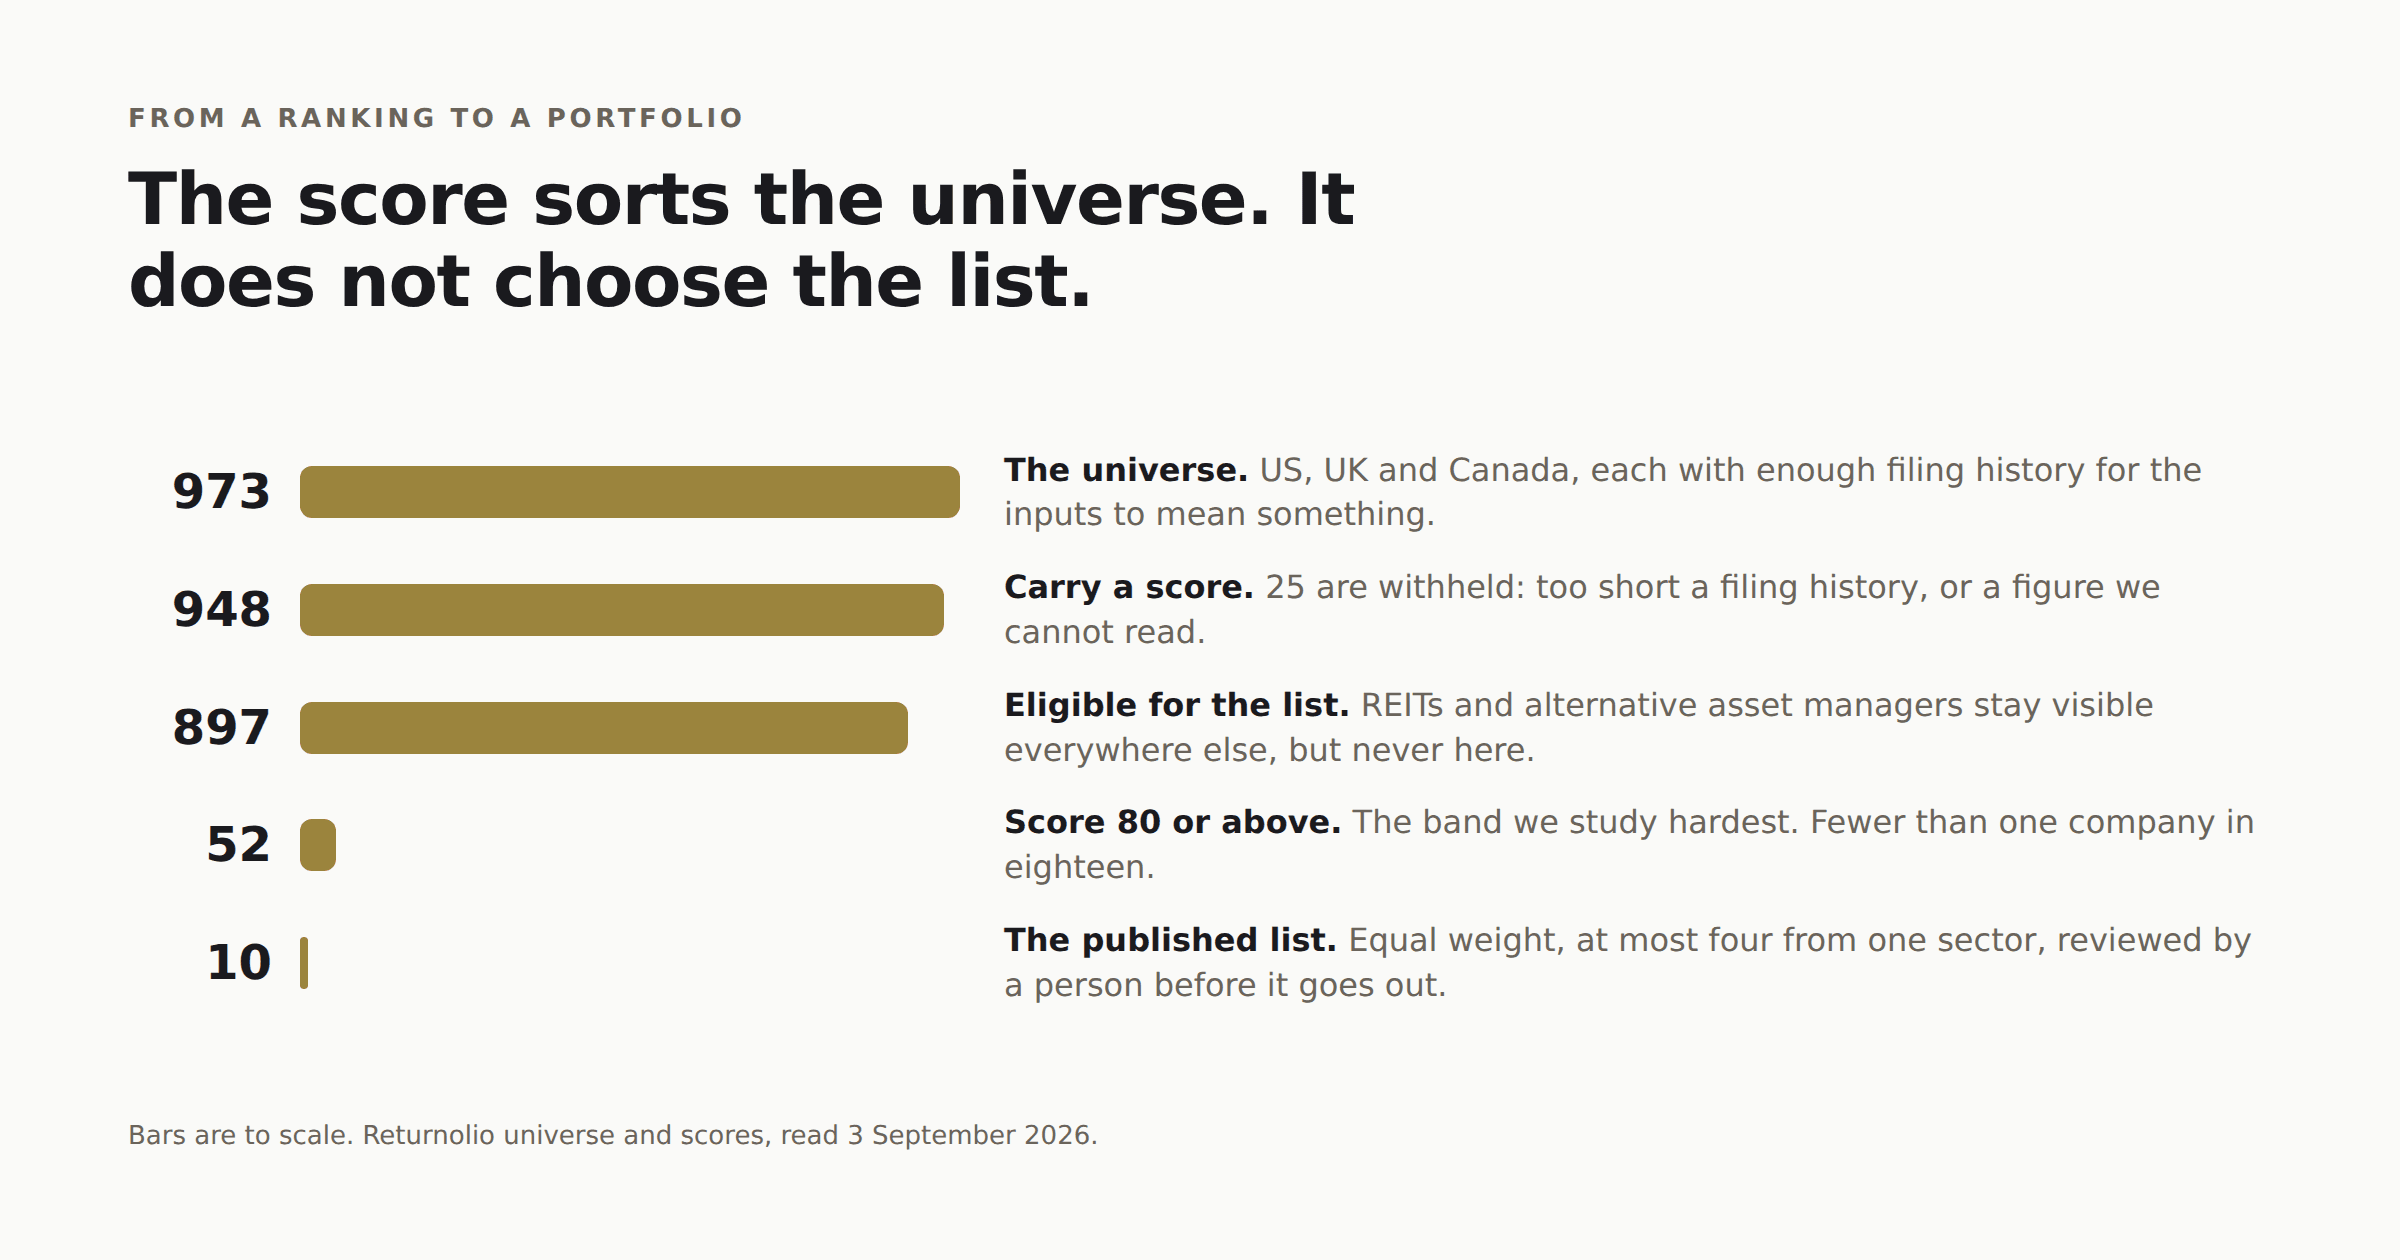
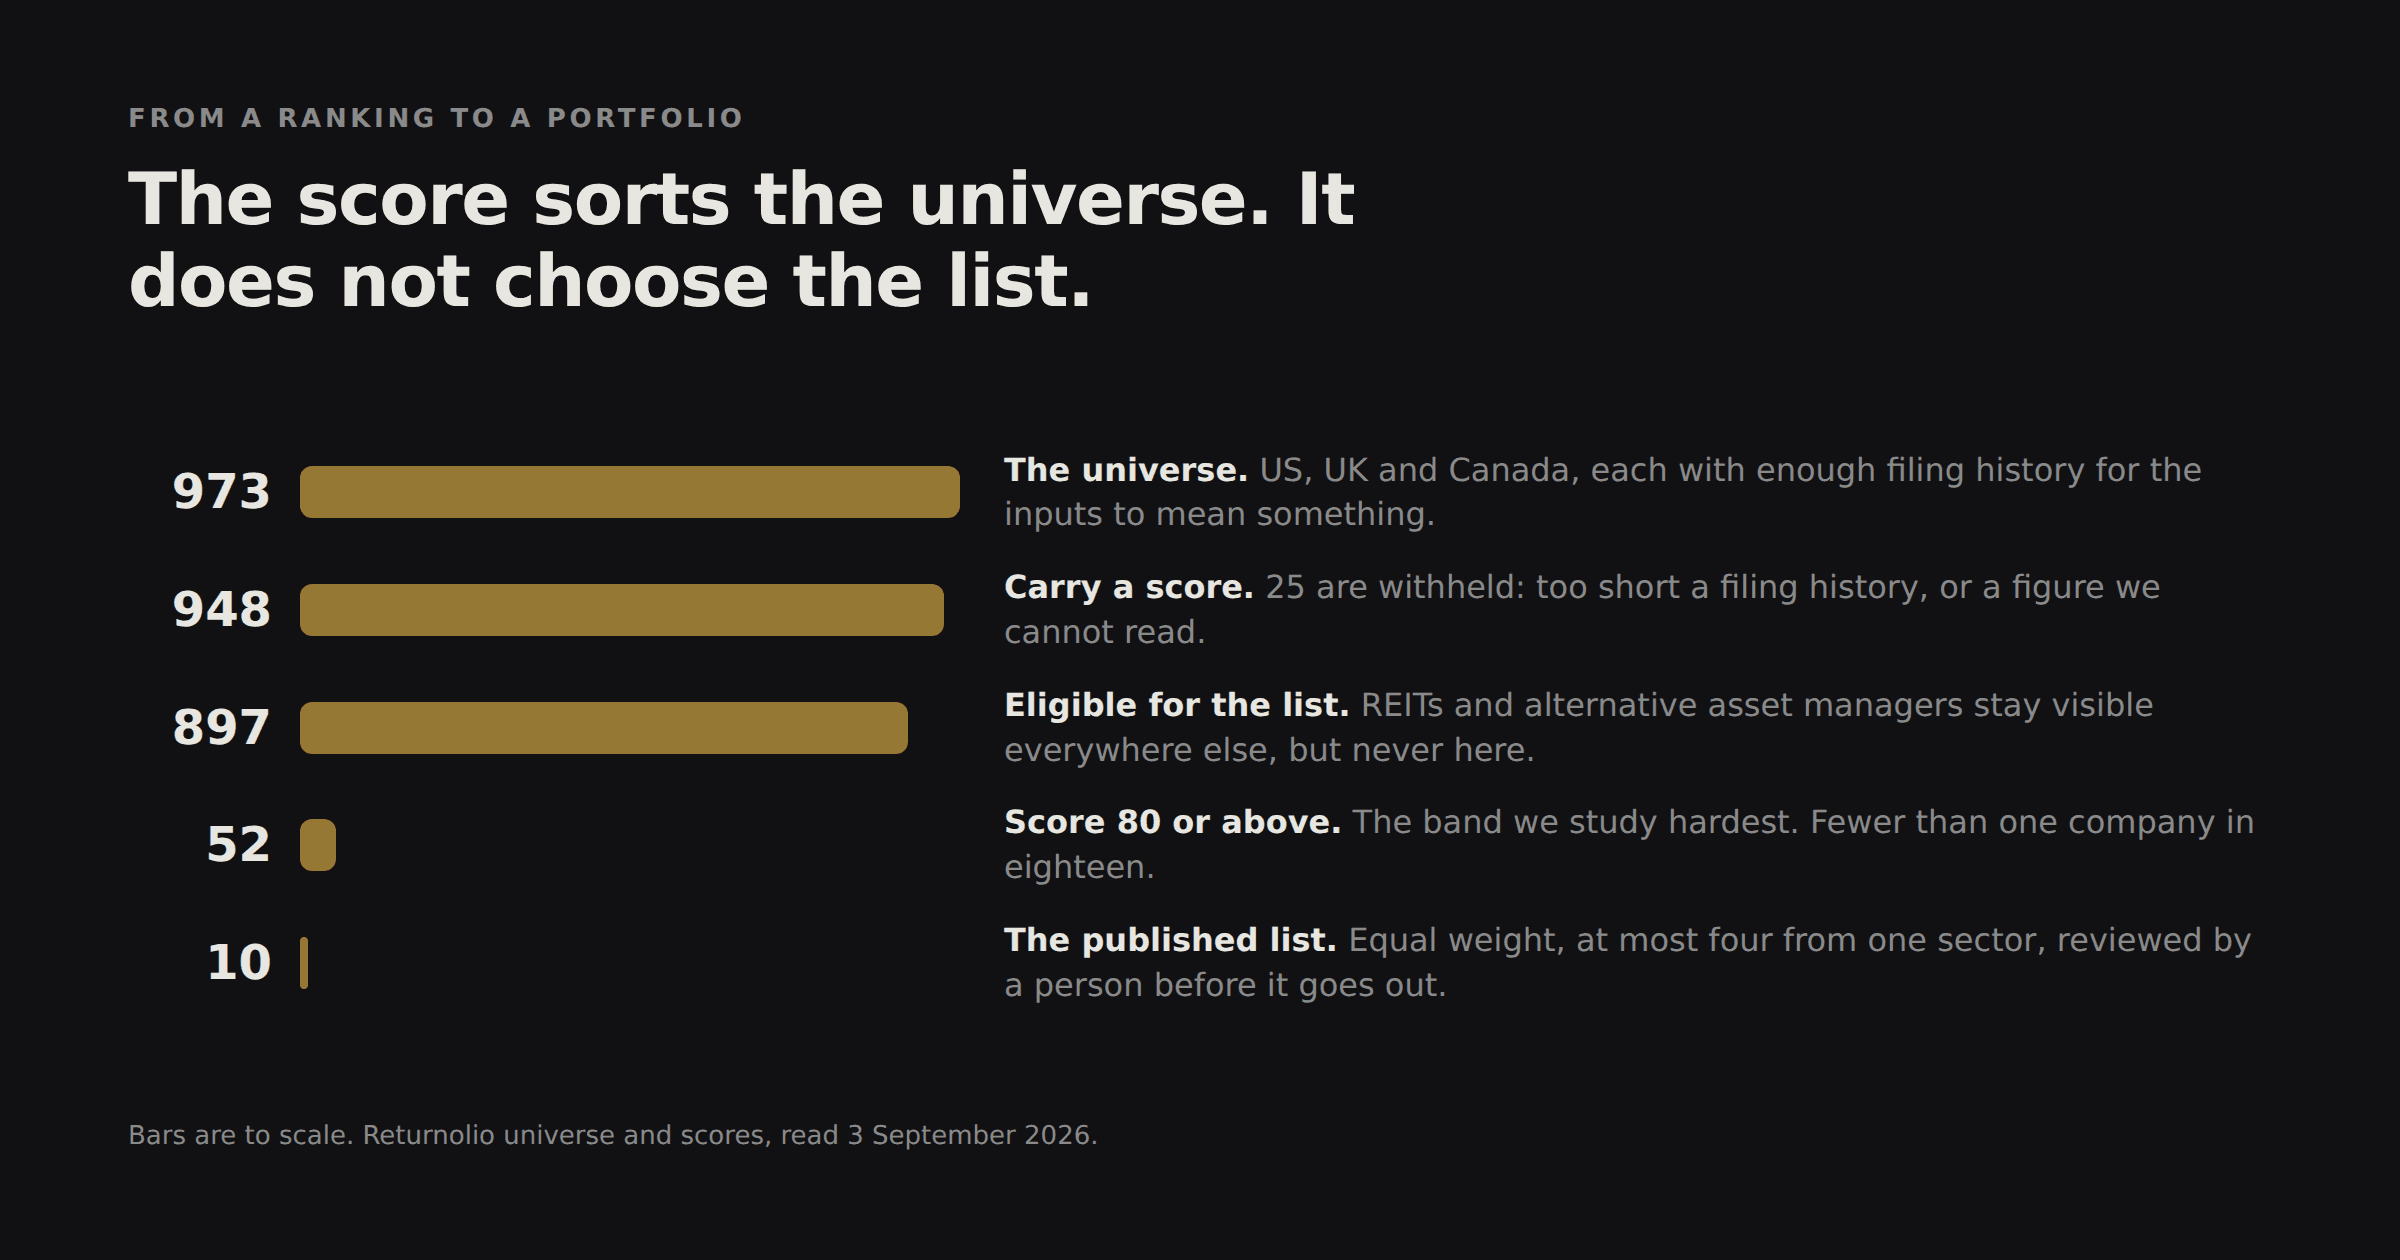
The steps are worth reading slowly, because most of them remove companies that scored perfectly well.
Measured on 3 September 2026: of the 973 companies we cover, 948 carry a score; the other 25 are withheld because their filing history is too short or because we cannot read a figure we need. Another 76 are eligible for every other part of the product but never for this list. Of the 897 that remain, 52 sit in the 80 to 100 band, which is fewer than one company in eighteen. Ten get published.
That last step is the one people assume is arithmetic. It is not.
Seven core picks, and up to three riding momentum
Since the October 2026 edition, the ten carry two kinds of conviction. Seven picks are the model's highest-conviction names, the compounding discipline everything below describes. Up to three more are Moonshot Detected Companies: names showing strong, sustained market momentum (a price that has been rising for a while and keeps rising) that pass the same safety filters. They are included only when our reading of market conditions favors them. In months when it does not, the edition simply carries ten core picks.
The momentum picks are full members of the list: the same weight going in, the same sector cap, the same review. They are badged on the Top 10 page so the two kinds of conviction never blur.
We hold on, and we swap rarely
The temptation with a monthly list is to rebuild it monthly. Something new is always scoring a little higher, and churn feels like work.
It is not. Trading costs money, taxes bite, and a business needs years to prove a thesis, the case for owning it. So we only replace the weakest holding when a challenger beats it by a clear margin, not by a hair. Most months, little or nothing changes, and the boring answer is usually the right one.
If we still believe in the business, a falling price on its own is not a reason to sell. The model carries its own risk controls, and a person reviews every change before it ships. If the thesis breaks, we sell at any price.
A cap of four per sector
No more than four of the ten can come from one sector, even when the score says they deserve it.
The score has no opinion about correlation. Left alone it would happily hand us ten semiconductor names in a good year for semiconductors, and that is not a concentrated portfolio, it is one bet with ten tickers on it. The cap costs us return in the years when the hot sector keeps running. We take that trade.
Cash is a choice, not a rule
Some months part of the portfolio waits in cash, some months none of it does. When we see a good buy, the cash goes to work.
Two things we leave out entirely
REITs. Real estate investment trusts, the companies that own buildings and pass the rent through to shareholders. Their economics run through property values and rent, which the measures behind our score were not built to read. They stay visible on their own pages; they just do not make the list.
Alternative asset managers. Firms that run private investment funds for a living. Only nine tickers in the universe, which is too few to score against anything reliably. Better to admit that than to fake a percentile.
What the list actually is
It is a real portfolio of ten.
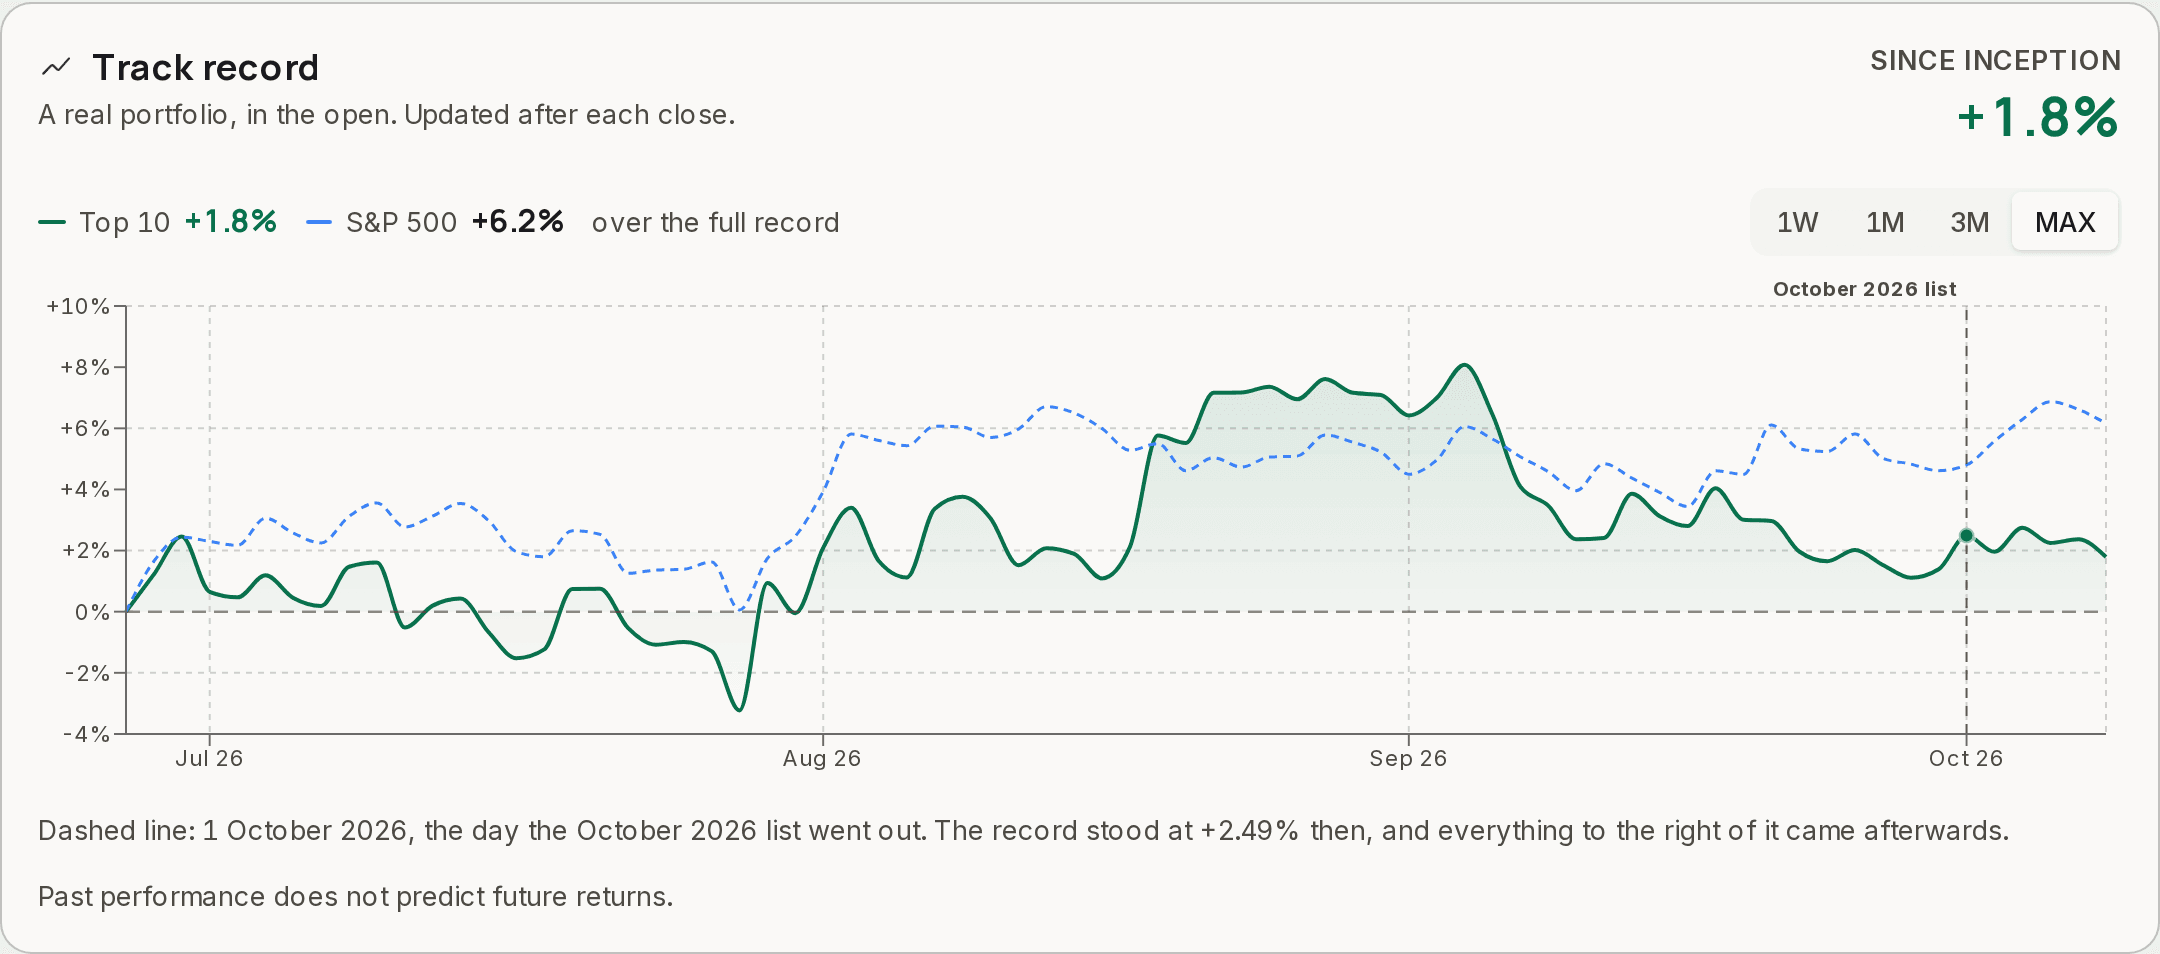
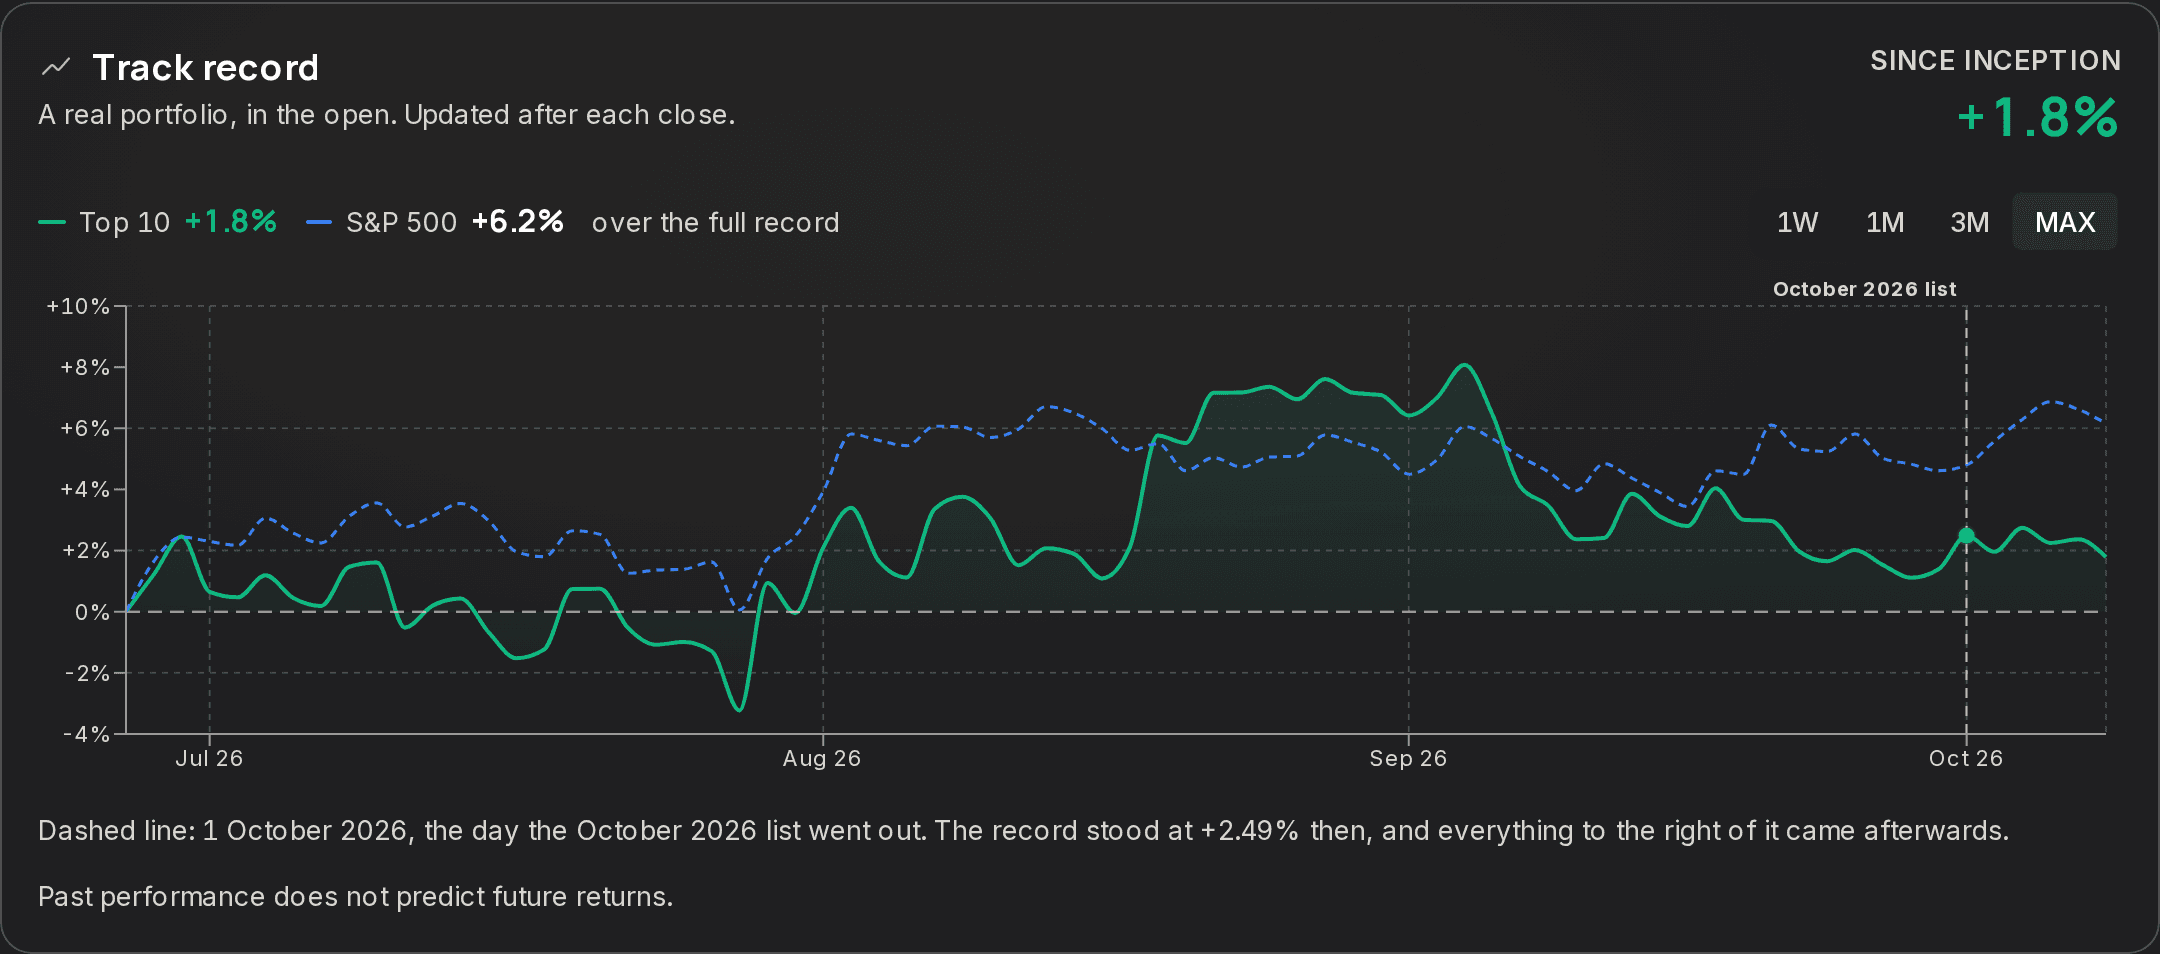
The live record is on the Top 10 page in the app, and the same curve, marked every close, is on our home page.
That is the honest version of the pitch, and it also explains the discipline above. A list you have to live inside gets built differently from a list you only have to publish.
The rules above are the shape of the portfolio, and they are published because you should know what you are reading. The score thresholds that drive them are ours.
One thing worth being plain about, because the backtest page reports a strictly mechanical result. This list is not strictly mechanical. Before an edition goes out it gets a review, and names are sometimes taken off it by hand, most often when news has already moved a price that the financial statements have not caught up with yet. The model cannot see that; it is reading filings, and the filing has not happened.
The backtest is mechanical because a test with judgement in it proves nothing. The list has judgement in it because a month is not a simulation. Both numbers are published, so you can watch the difference rather than take our word for which one is better.
On the page
Every one of these is visible to you
- Ten names, bought at equal weight and then left to run, reviewed monthly, no borrowed money
- The composition: seven core picks plus up to three momentum picks
- A cap of four companies from any one sector
- Cash held when it is useful, never as a fixed share
- What is deliberately left out of the list, and why
- Every past edition, kept up after the fact
Kept internal
Named, so you know what you are not seeing
- The re-ranking cut-off that decides when a name is swapped
- The momentum measure and the market-conditions rule behind the momentum slots
- How a tie between two candidates is settled
- The final review step before an edition is published
Common questions
Is the Top 10 a portfolio or a watchlist?
A portfolio. A real one that we manage, reviewed monthly. Every name goes in at the same weight and is then left alone, so a winner is allowed to grow into a bigger share of the book instead of being trimmed back each month. That is why the live weights drift apart over time, and why the backtest, which does reset to equal weight every month, does not match the real book exactly. Changes are disclosed with the monthly edition, after the fact, so it is a record of what was done rather than a queue of what to do next.
Why cap the list at four companies per sector?
Because a ranking with no cap will happily hand you ten names that all fall together. The cap costs some ranked upside and buys the list a reason to survive a sector going out of fashion.
Why swap names rarely?
Turnover costs money and usually buys noise. A company earns its place over years, and the bar for replacing one is deliberately high enough that a single month of underperformance does not clear it.
The score ranks the universe. It does not choose the list. Ten names, bought at equal weight and left to run, no more than four in one sector, and a holding stays until a challenger clearly beats it.
Past performance does not guarantee future results, and nothing here is investment advice. Always do your own research.
Was this page helpful?