

Smart Money: insider, congressional and institutional trades
Company officers, members of Congress and the institutions that file 13Fs all have to disclose what they trade. Smart Money collects those filings into one place with the date attached, so you can always see how old a trade is.
Last updated July 19, 2026
Company officers, members of Congress and large institutions are all required to disclose what they trade. The disclosures are public, scattered across filing systems, and awkward to read. Smart Money collects them into one place with the dates attached, so you can always see how old a trade is.
Insider trading
Officers and directors file when they buy or sell their own company's stock. They know more about the business than any outside analyst does. That is what makes the disclosures worth reading. It is also why there are strict rules about when insiders may trade at all.
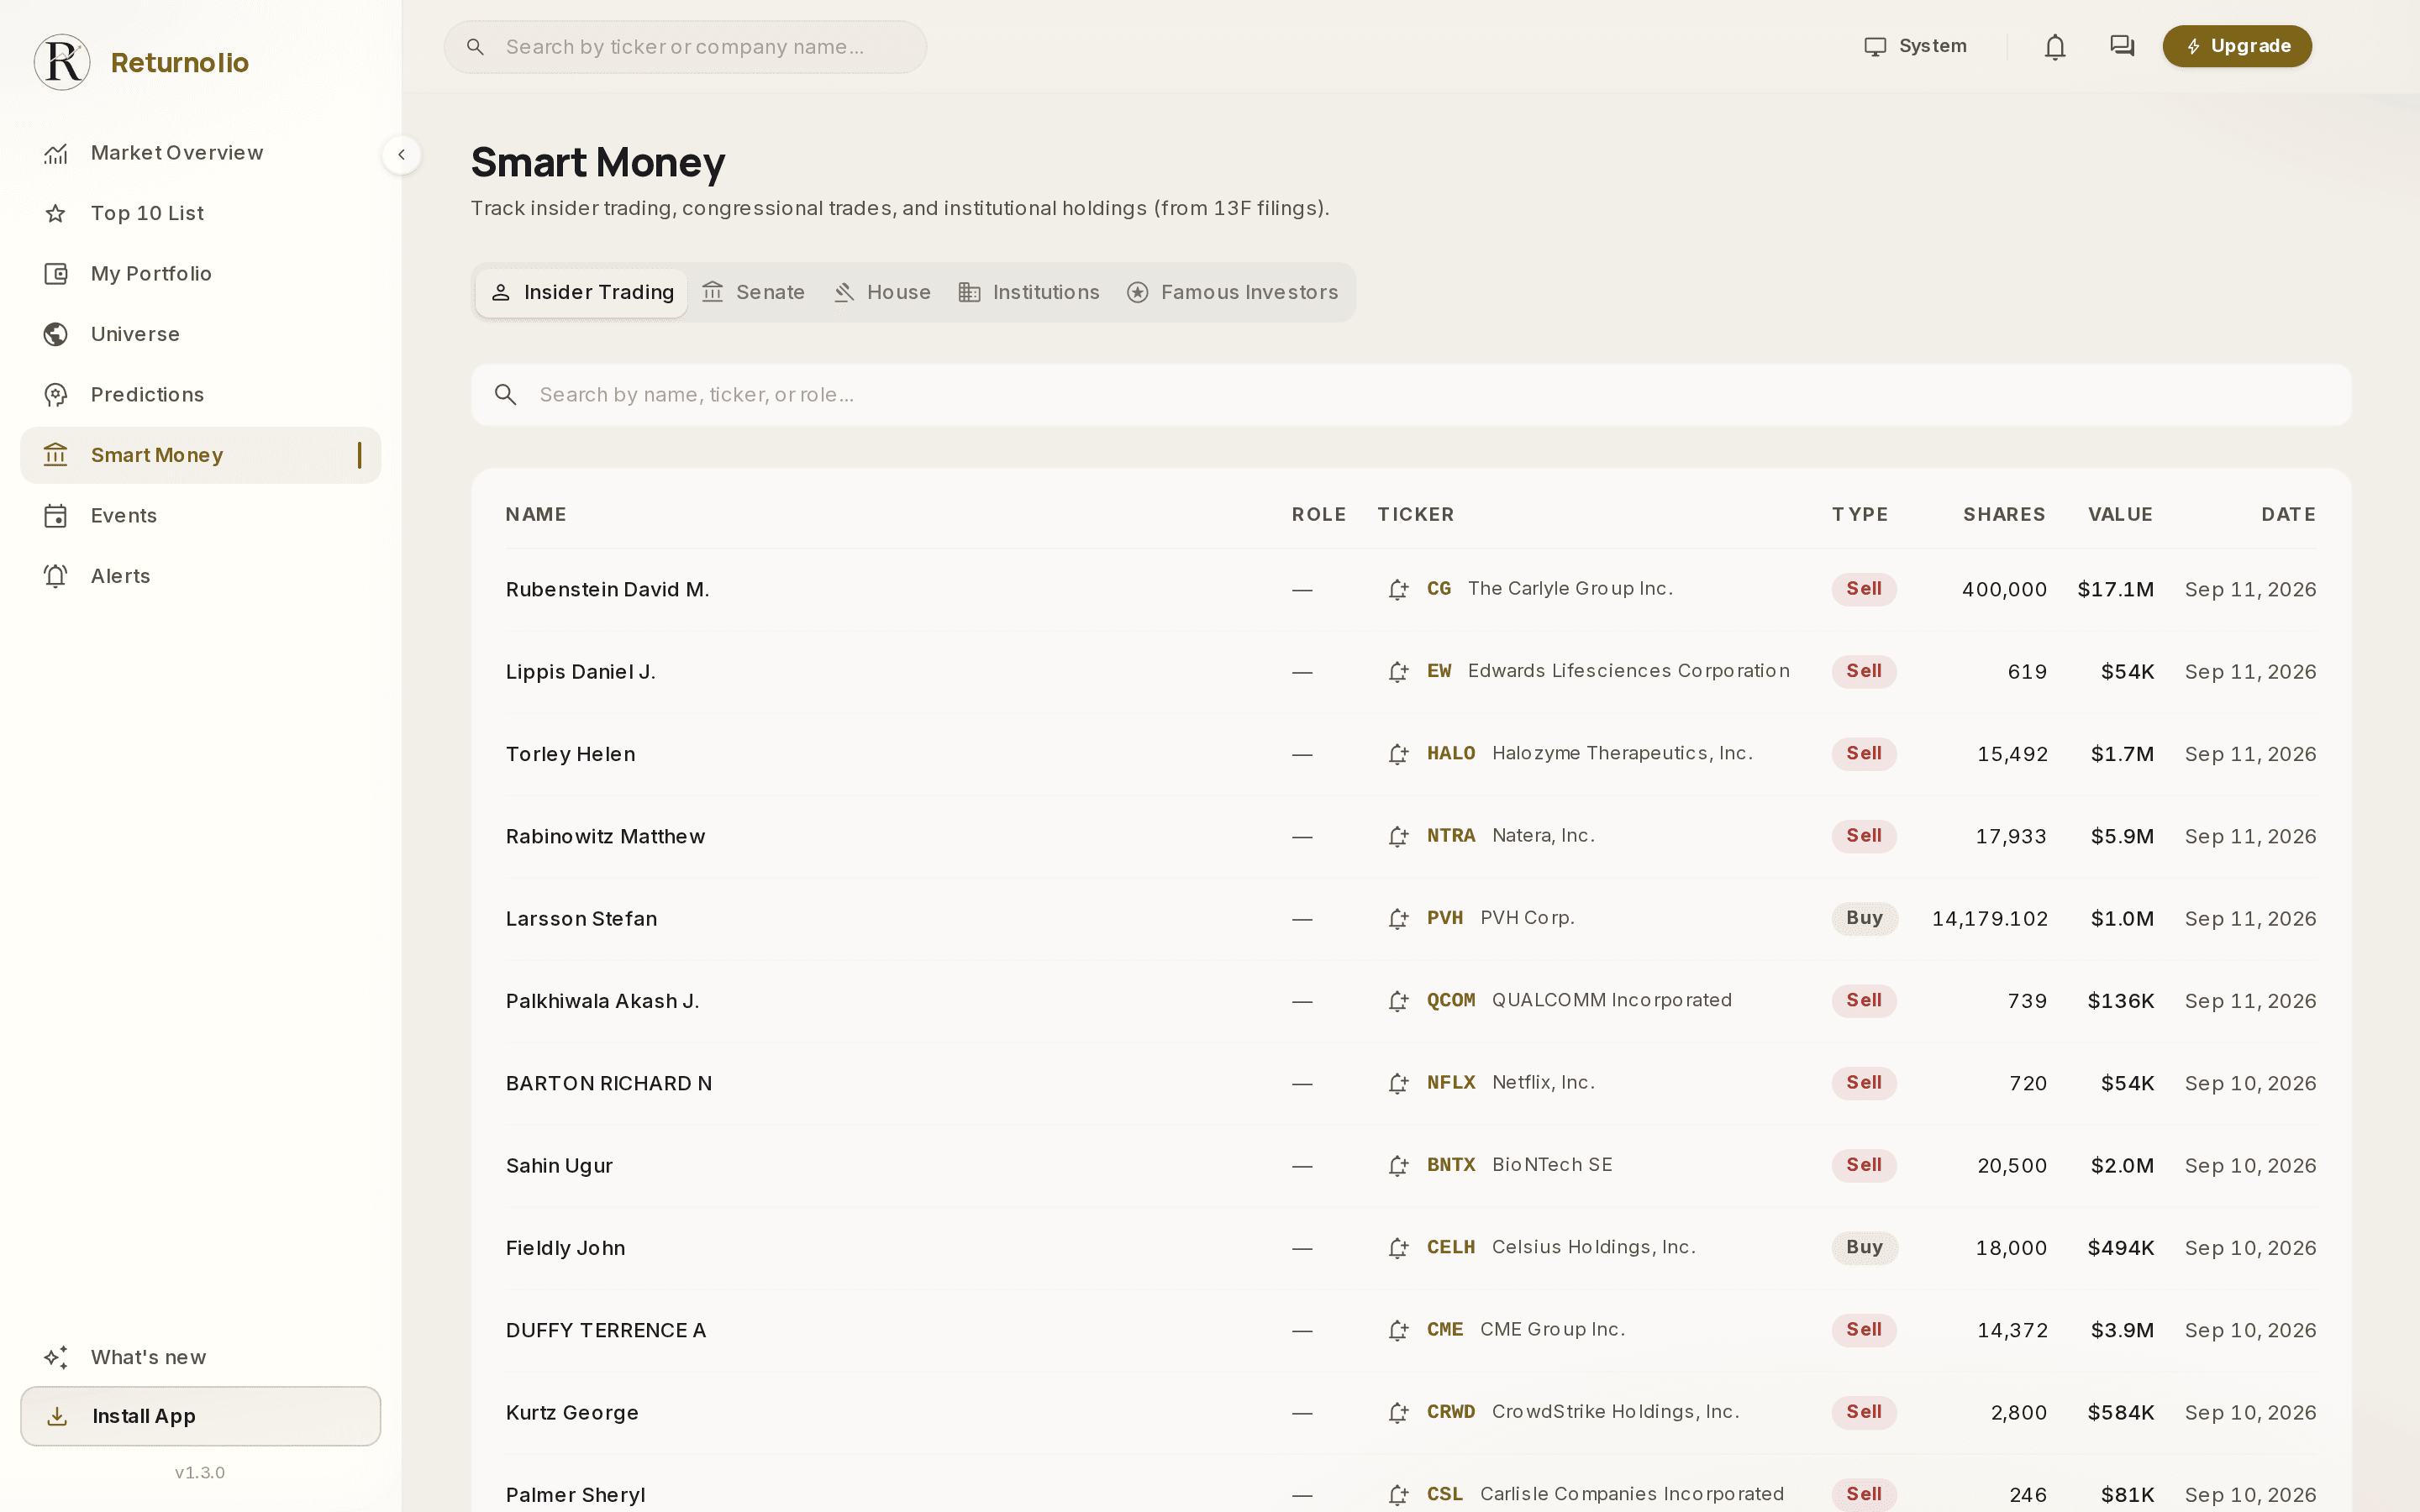
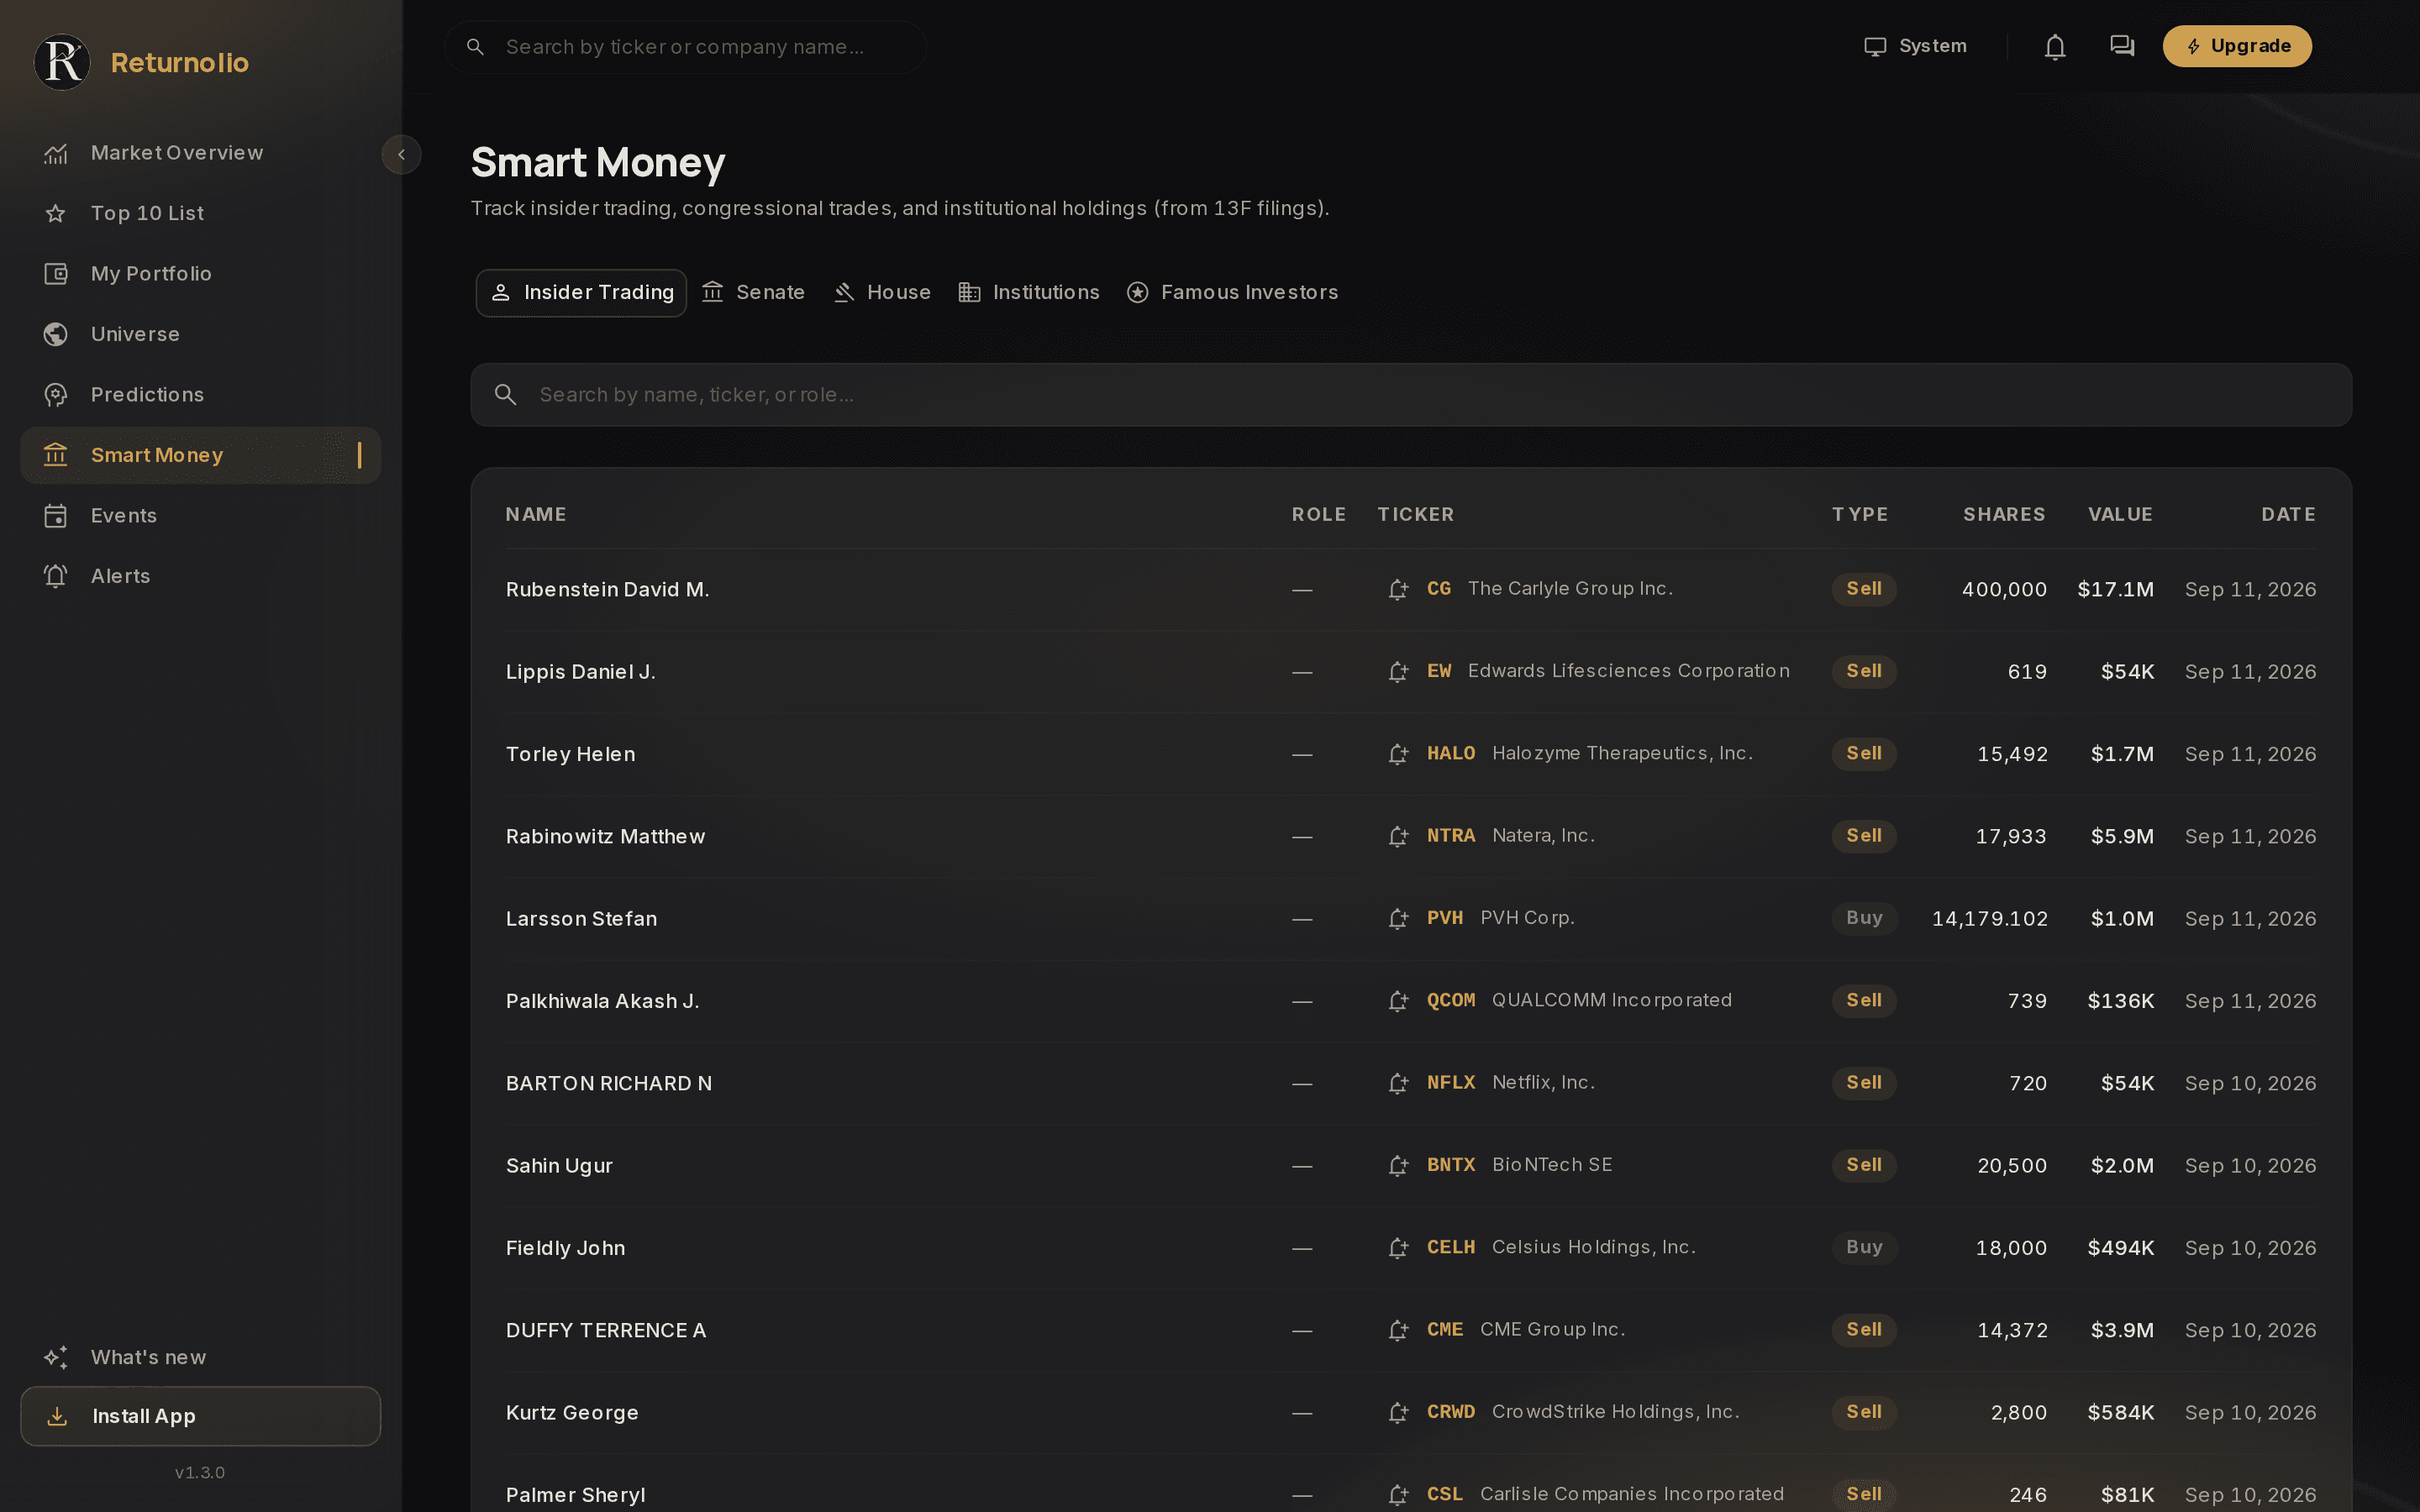
Read buys and sells differently
An insider sale can mean a scheduled diversification, a tax bill, a divorce or a house, and most sales are none of your business as an investor. Reading a wave of routine sales as a verdict on the company is the most common mistake made with this data. Neither direction tells you what a share is worth.
Senate and House
Members of the US Senate and House disclose their trades under the STOCK Act, the law that puts those trades on the public record. Each chamber has its own tab. Disclosure deadlines are generous, so these arrive well after the fact and are best read as a pattern over months rather than as anything timely.
Institutions
Large managers file quarterly 13F reports listing their US equity positions.
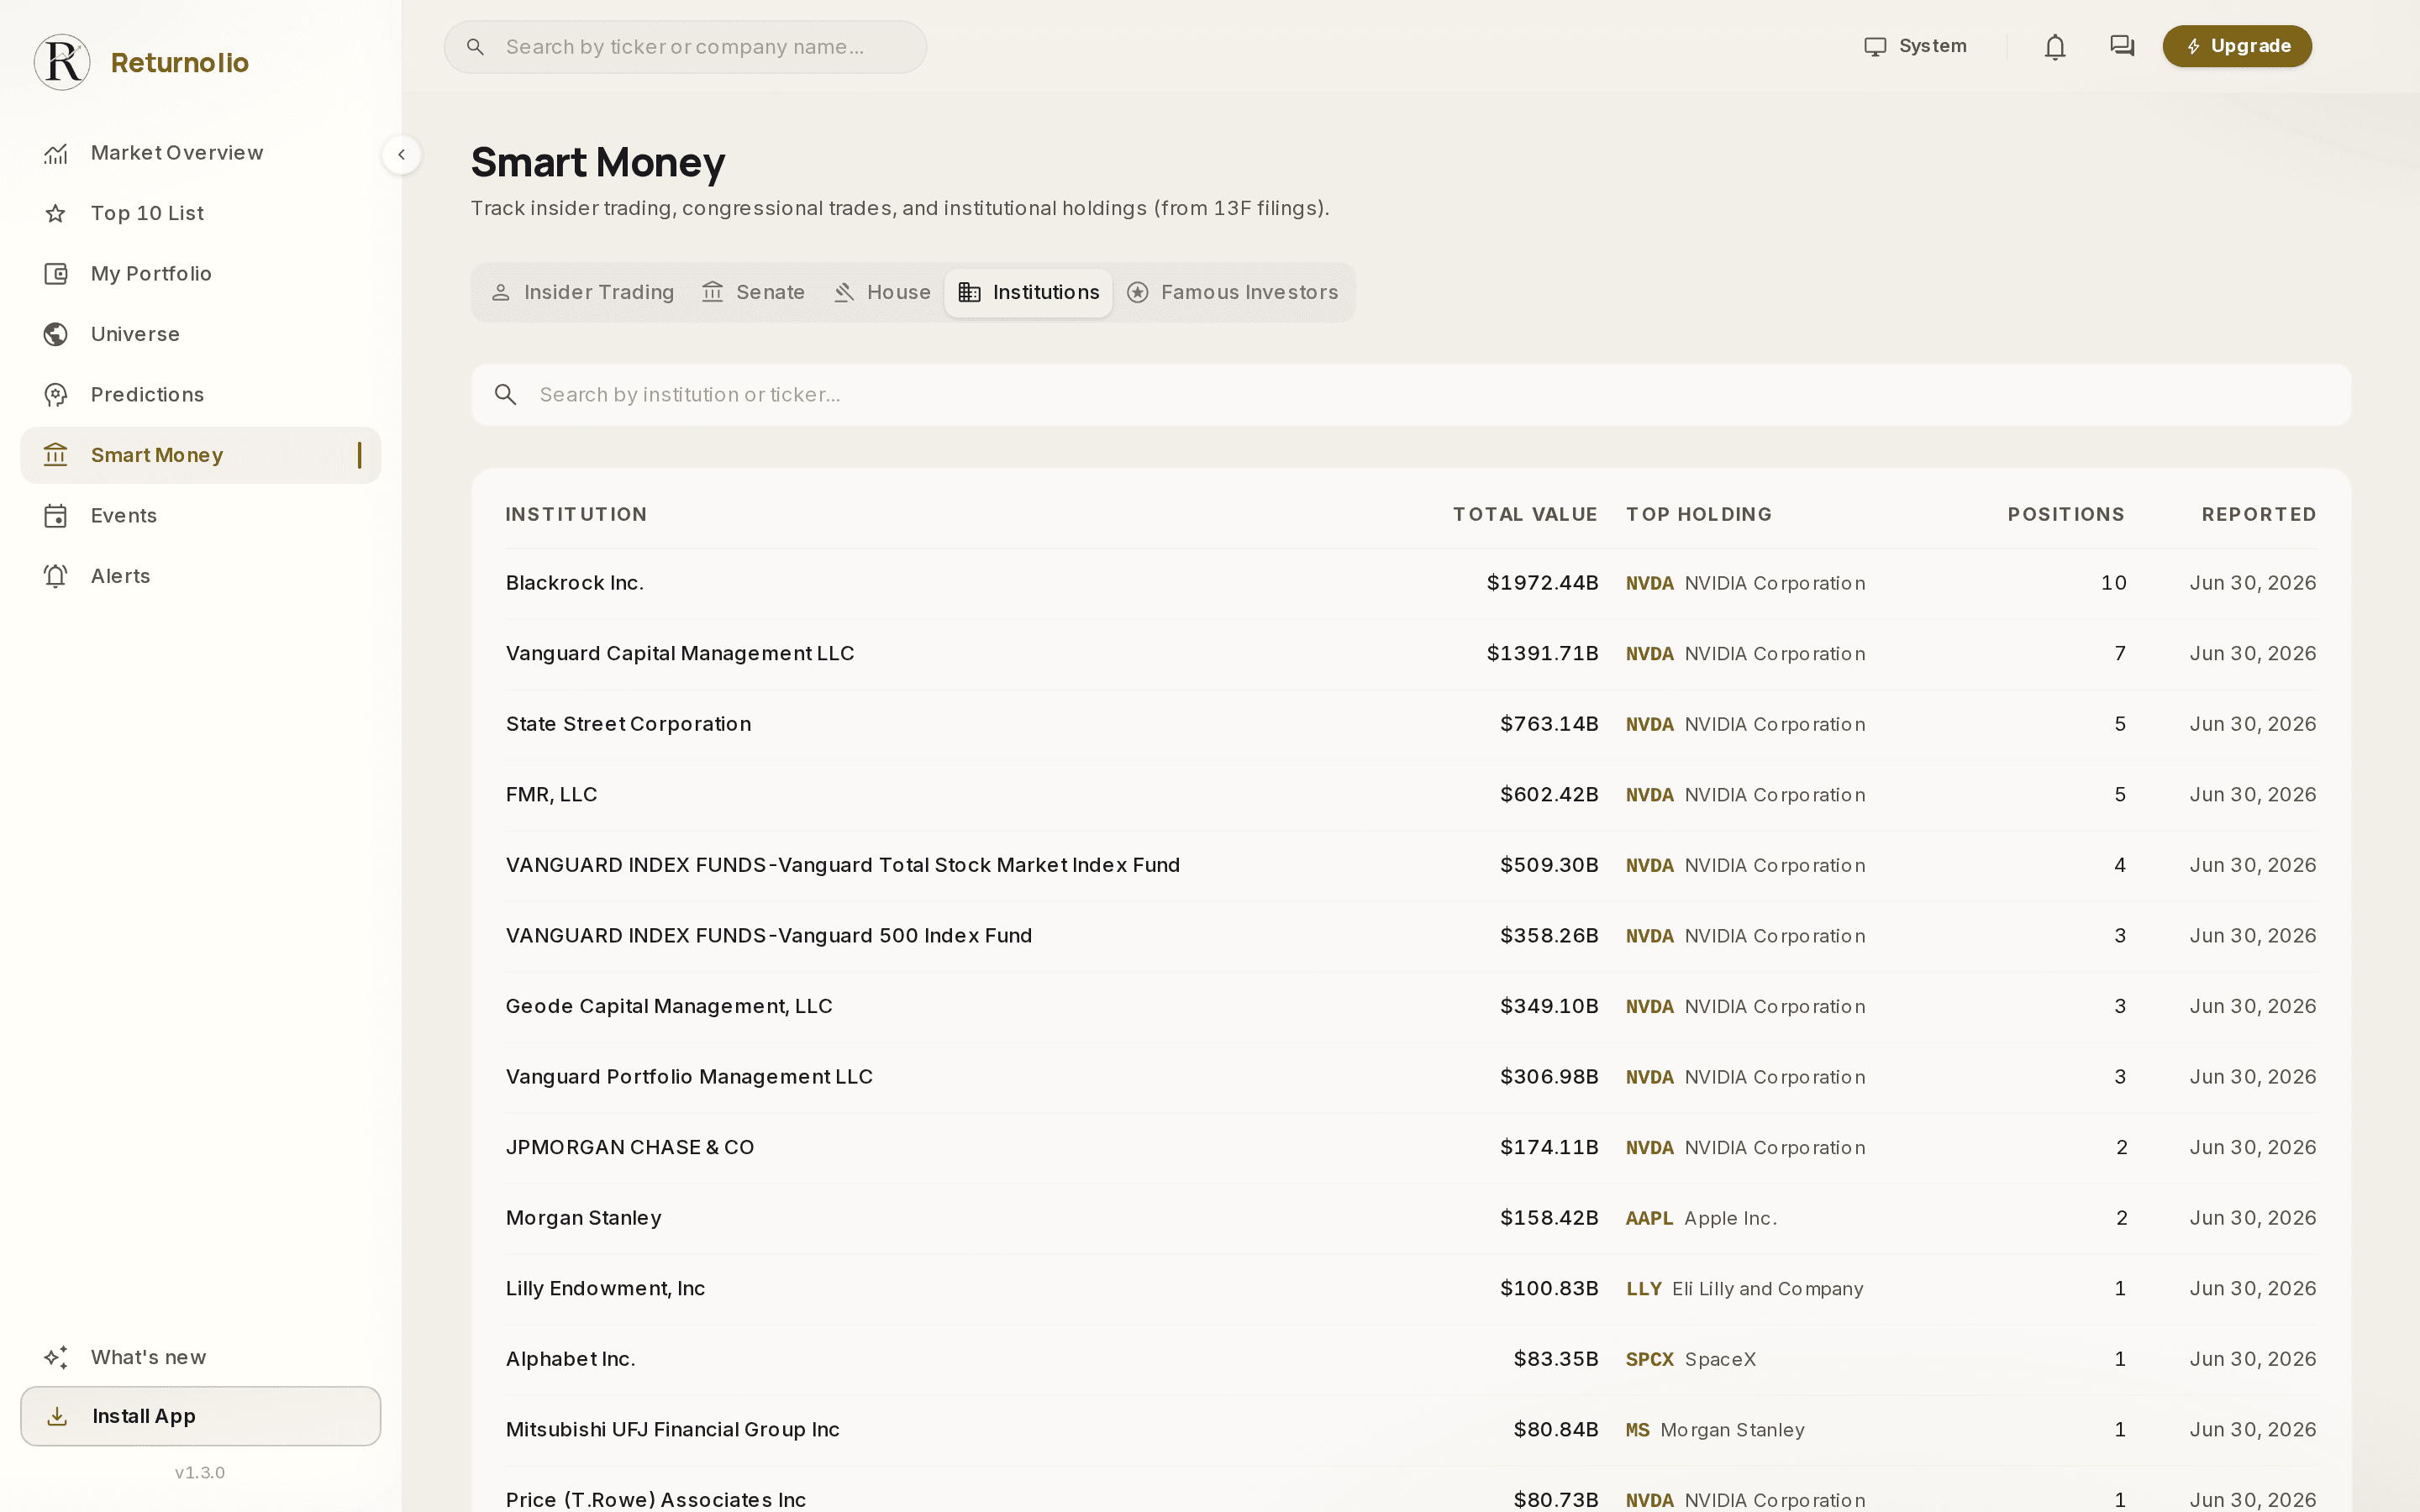
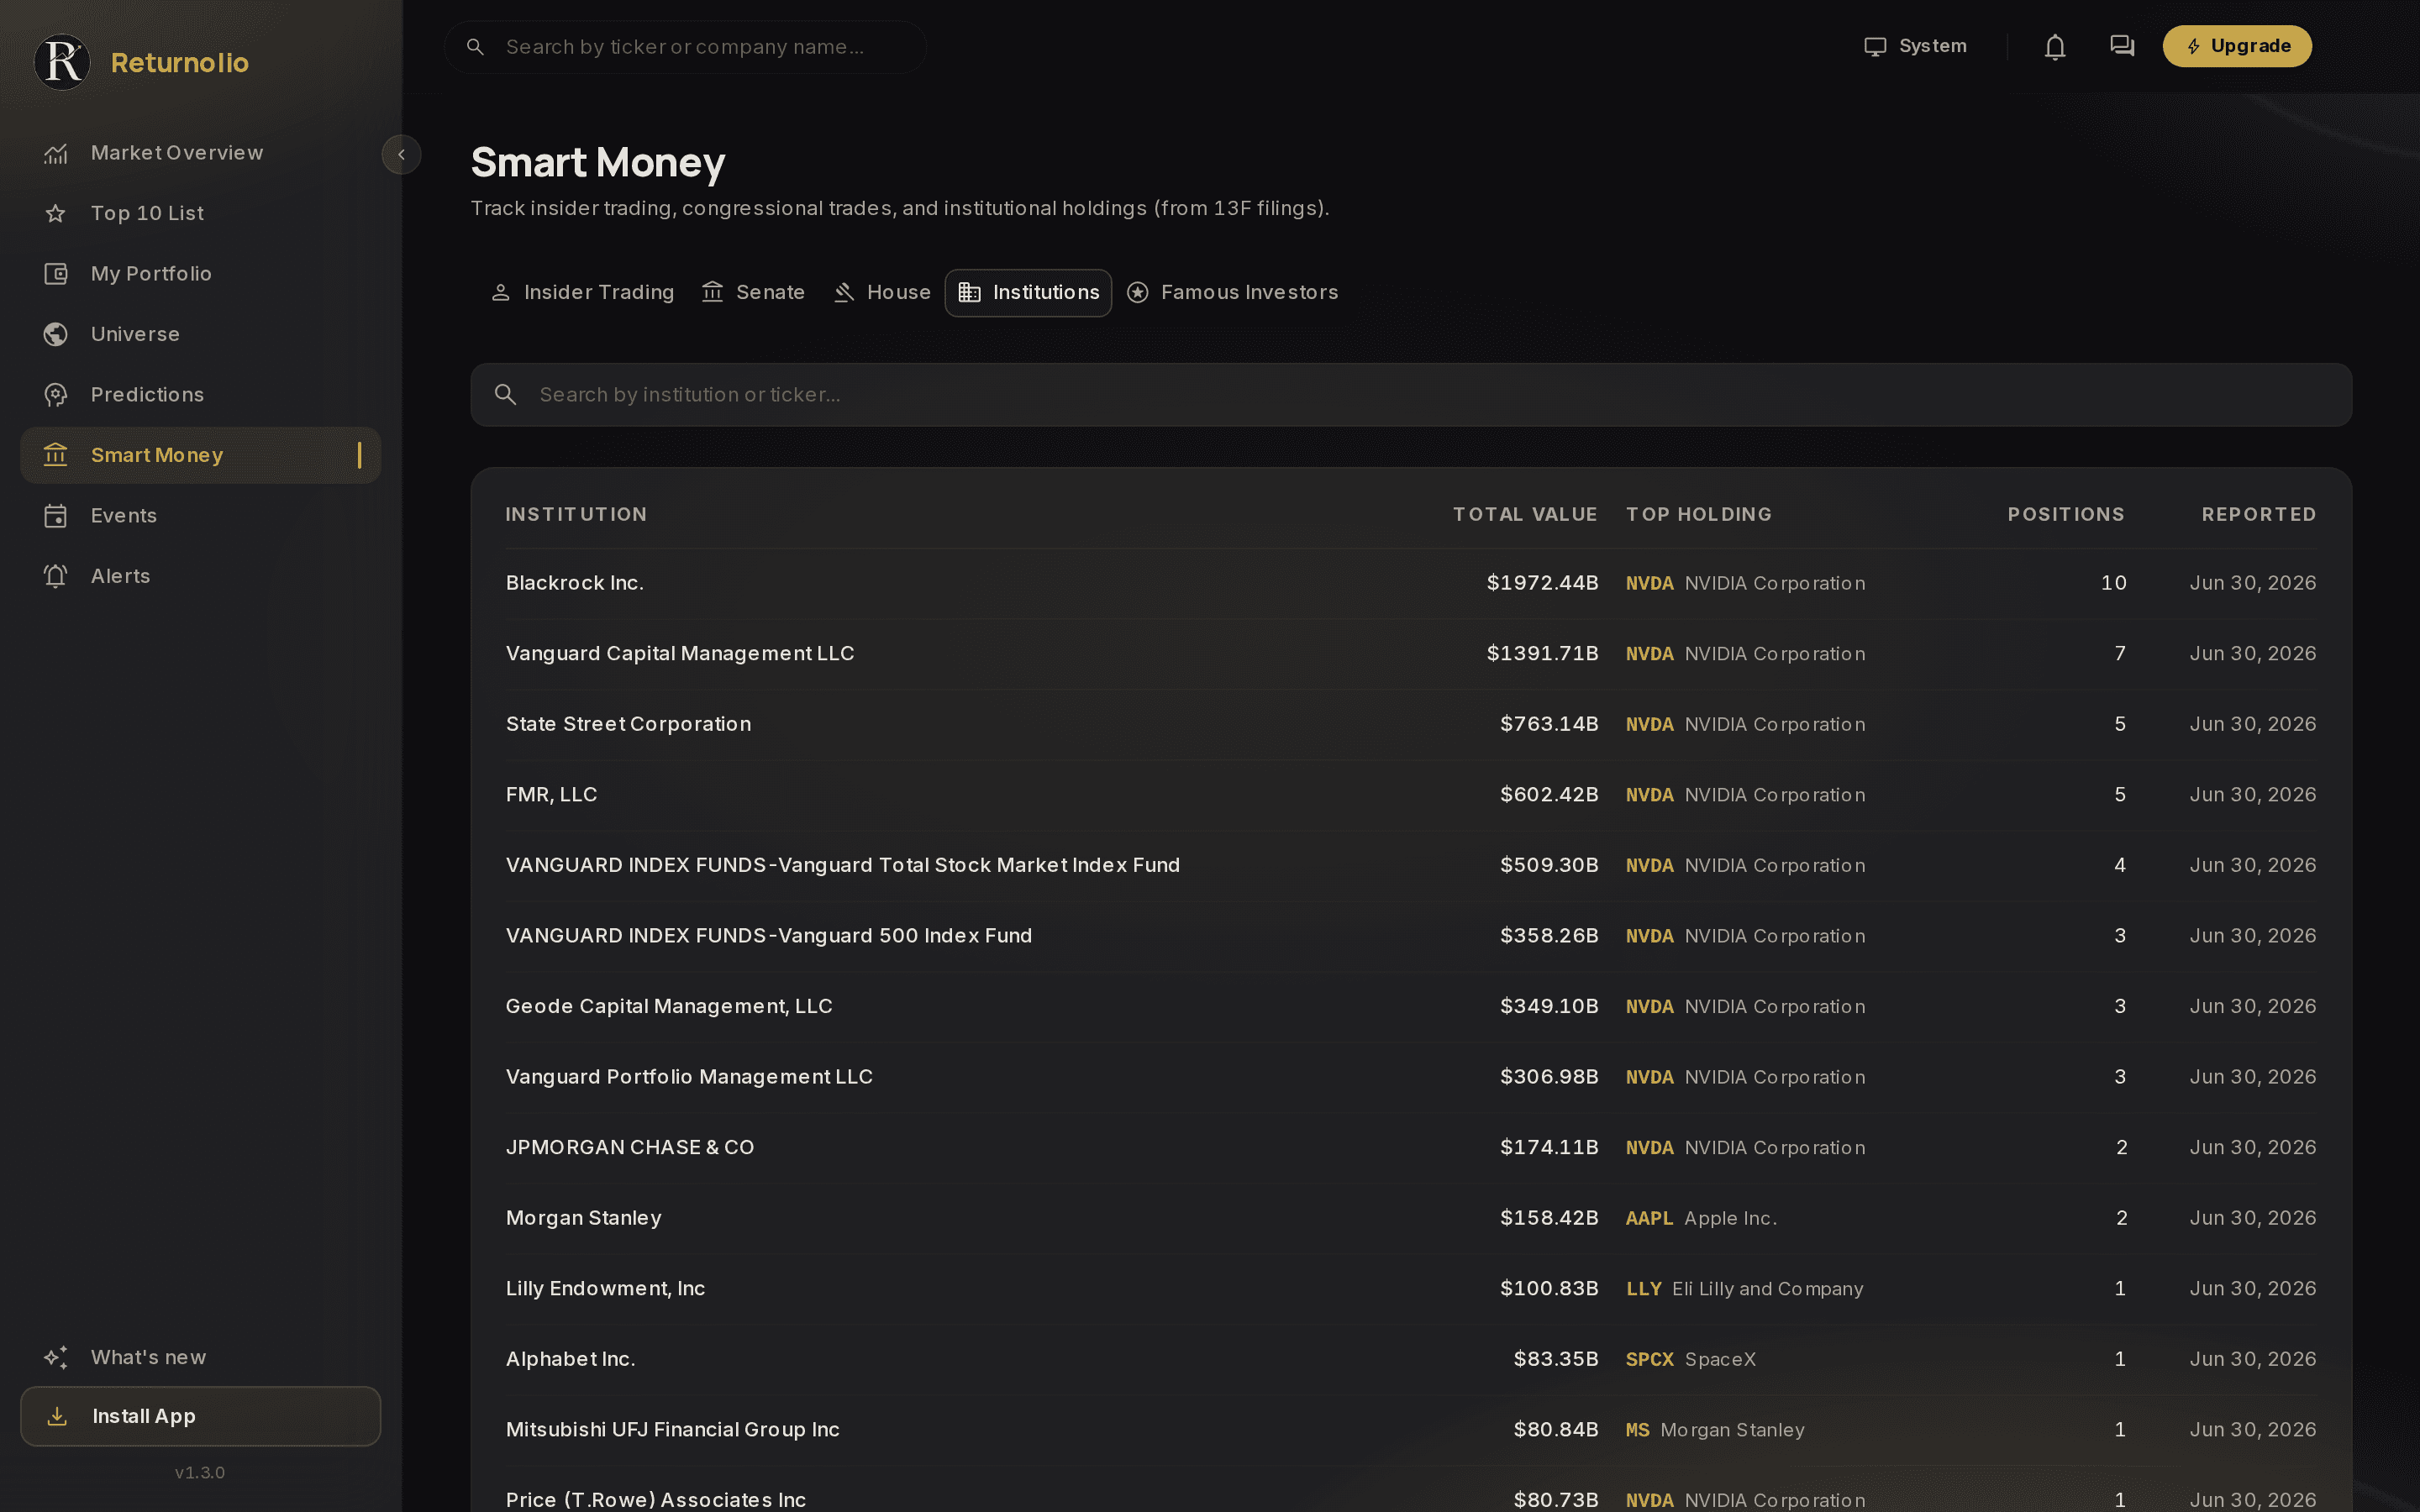
13F data is a quarterly snapshot, filed late
A 13F describes positions as they stood on the quarter-end date, and the filing deadline falls 45 days after that. A trade made early in the quarter is therefore around four and a half months old by the time it becomes public, and the manager may have sold out of it since. The reporting date column is there so you always know which quarter you are looking at.
Famous investors
A hand-picked tab following the filings of a small number of well-known managers, for people who want to watch specific names rather than scan the whole list.
How this connects to the score
Smart Money is on every company page and in the score breakdown; how the pillar is measured has its own page. It answers a different question from the rest, on a different clock, which is why you read it beside the fundamentals rather than through them. Knowing that insiders have been buying is worth something when you are reading everything else on the page. We do not rank companies by it on its own.
Educational and proprietary. This explains what our research does, not the exact formula behind it, and it is not personalised investment advice. See the full disclaimer.
Was this page helpful?