

AI stock summaries, and the facts they are limited to
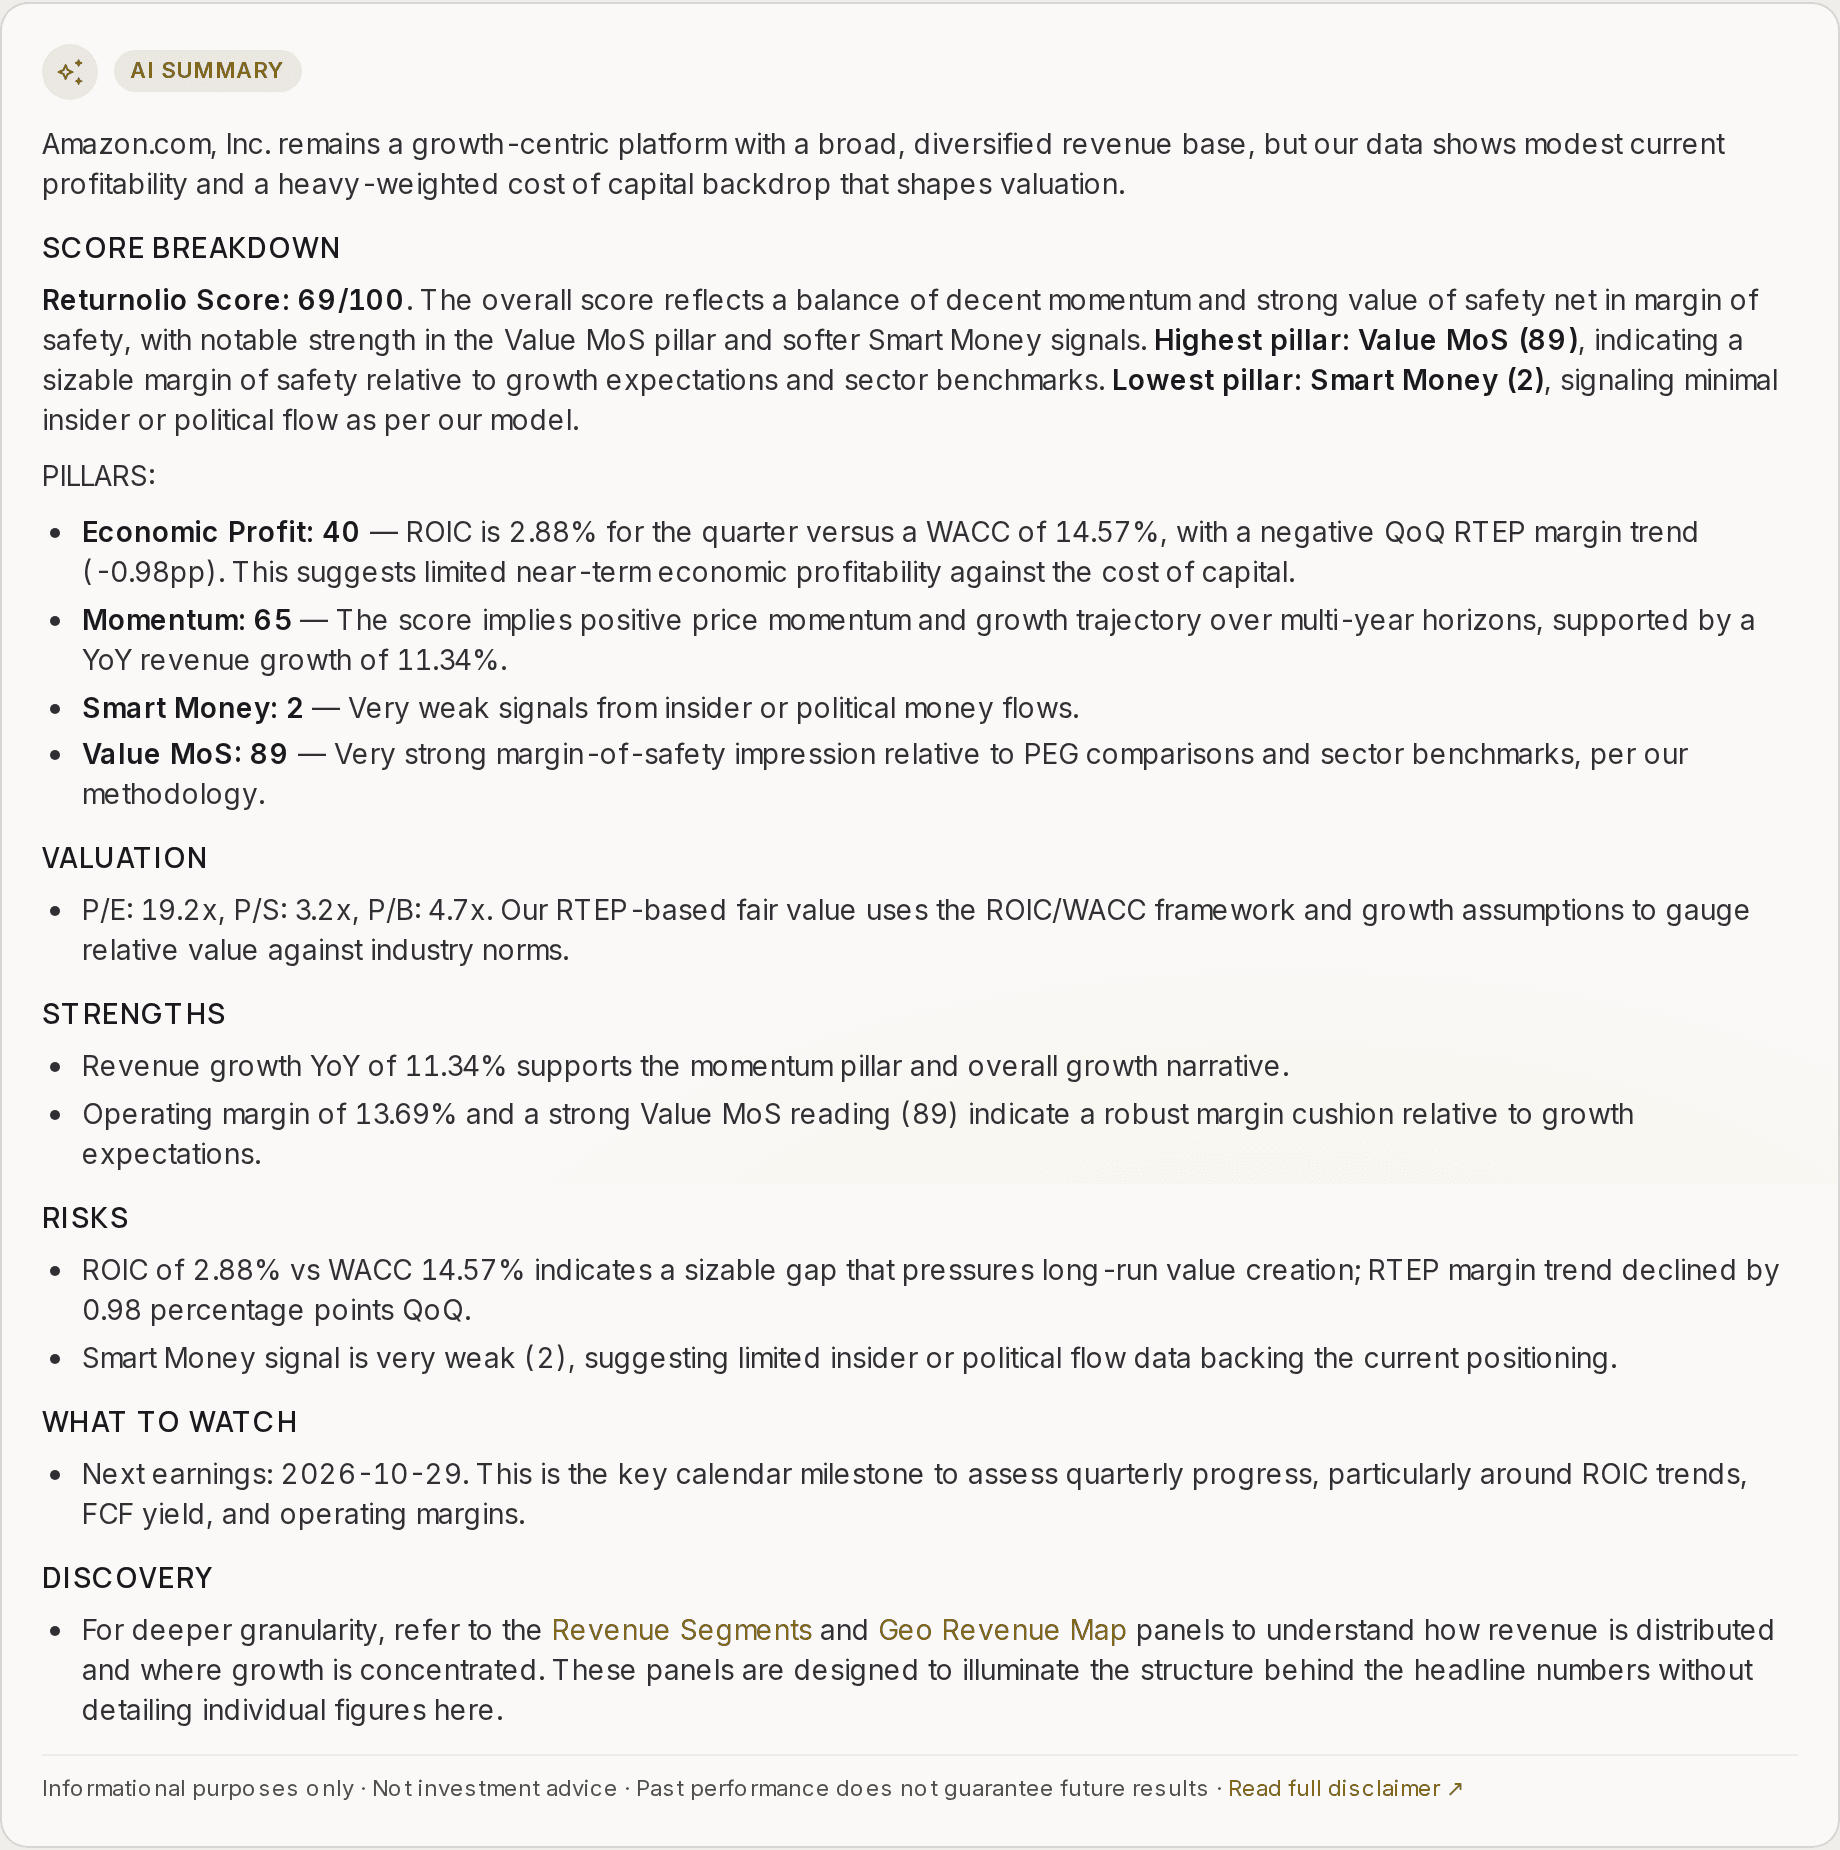
A written read on any company, produced from the same figures the score reads, to get you from a page of numbers to a hypothesis in about thirty seconds. It cannot browse the web and works only from the facts we hand it.
Last updated July 19, 2026
Every company page can produce a written summary of itself: what the score is saying, how the valuation looks, what the strengths and risks are, and what is worth watching next. It reads the same data the score reads.
The point is not to replace your reading. It is to get you from a page of numbers to a hypothesis in about thirty seconds, so you know whether the rest of the page deserves your afternoon.
What it is allowed to say
The summary works from a fixed set of facts we hand it: the pillar scores, the valuation multiples, profitability and balance-sheet figures, upcoming earnings dates, and recent headlines. It cannot browse, and it cannot reach for a number we did not give it.
That constraint is deliberate. A model with a number in front of it summarises; a model without one invents. So the work of keeping summaries honest happens before the model runs, in what we choose to put in front of it.
It is the difference between meeting notes written in the room and meeting notes written from memory a week later. The first kind can be checked line by line. We only publish the first kind.
It reports, it does not recommend
Summaries describe what the data shows. They do not tell you to buy or sell and they do not forecast a share price. Where one repeats a valuation read, such as a company screening as cheap on our own margin-of-safety pillar or an analyst consensus target, it is reporting a figure from the page, not issuing a target of its own. If one ever reads like a recommendation, that is a bug and we would like to hear about it.
Where the numbers come from
Every figure a summary quotes comes from the set of facts handed to it, which in turn comes from filings and from our scoring output. The model chooses which of them to lead with and which to emphasise; it does not choose their values.
The headline references recent news coverage, and the summary is instructed to use headlines only where they report something concrete, like a closed deal or a reported result, rather than speculation about what might happen.
Freshness
A summary carries the time it was generated, and it expires when the data underneath it changes, not on a timer. New figures for a company retire its summary, and the next person to open that page gets one written from the current numbers. A summary that has not been rewritten is one whose inputs have not moved. See Data freshness for the wider picture on update cycles.
Where else they appear
Summaries also appear as the market briefing on the market overview and as a portfolio-level read on your own holdings. Each has its own sections suited to what it covers, and the same rules apply to all of them: fixed facts in, description out, no recommendations.
Educational and proprietary. This explains what our research does, not the exact formula behind it, and it is not personalised investment advice. See the full disclaimer.
Was this page helpful?