

How often the data updates, and which clock you are reading
Prices refresh through the trading day and settle on the close, scores and summaries move daily, and fundamentals only move when a company files. Knowing which clock a number runs on is the difference between using it well and misreading it.
Last updated September 3, 2026
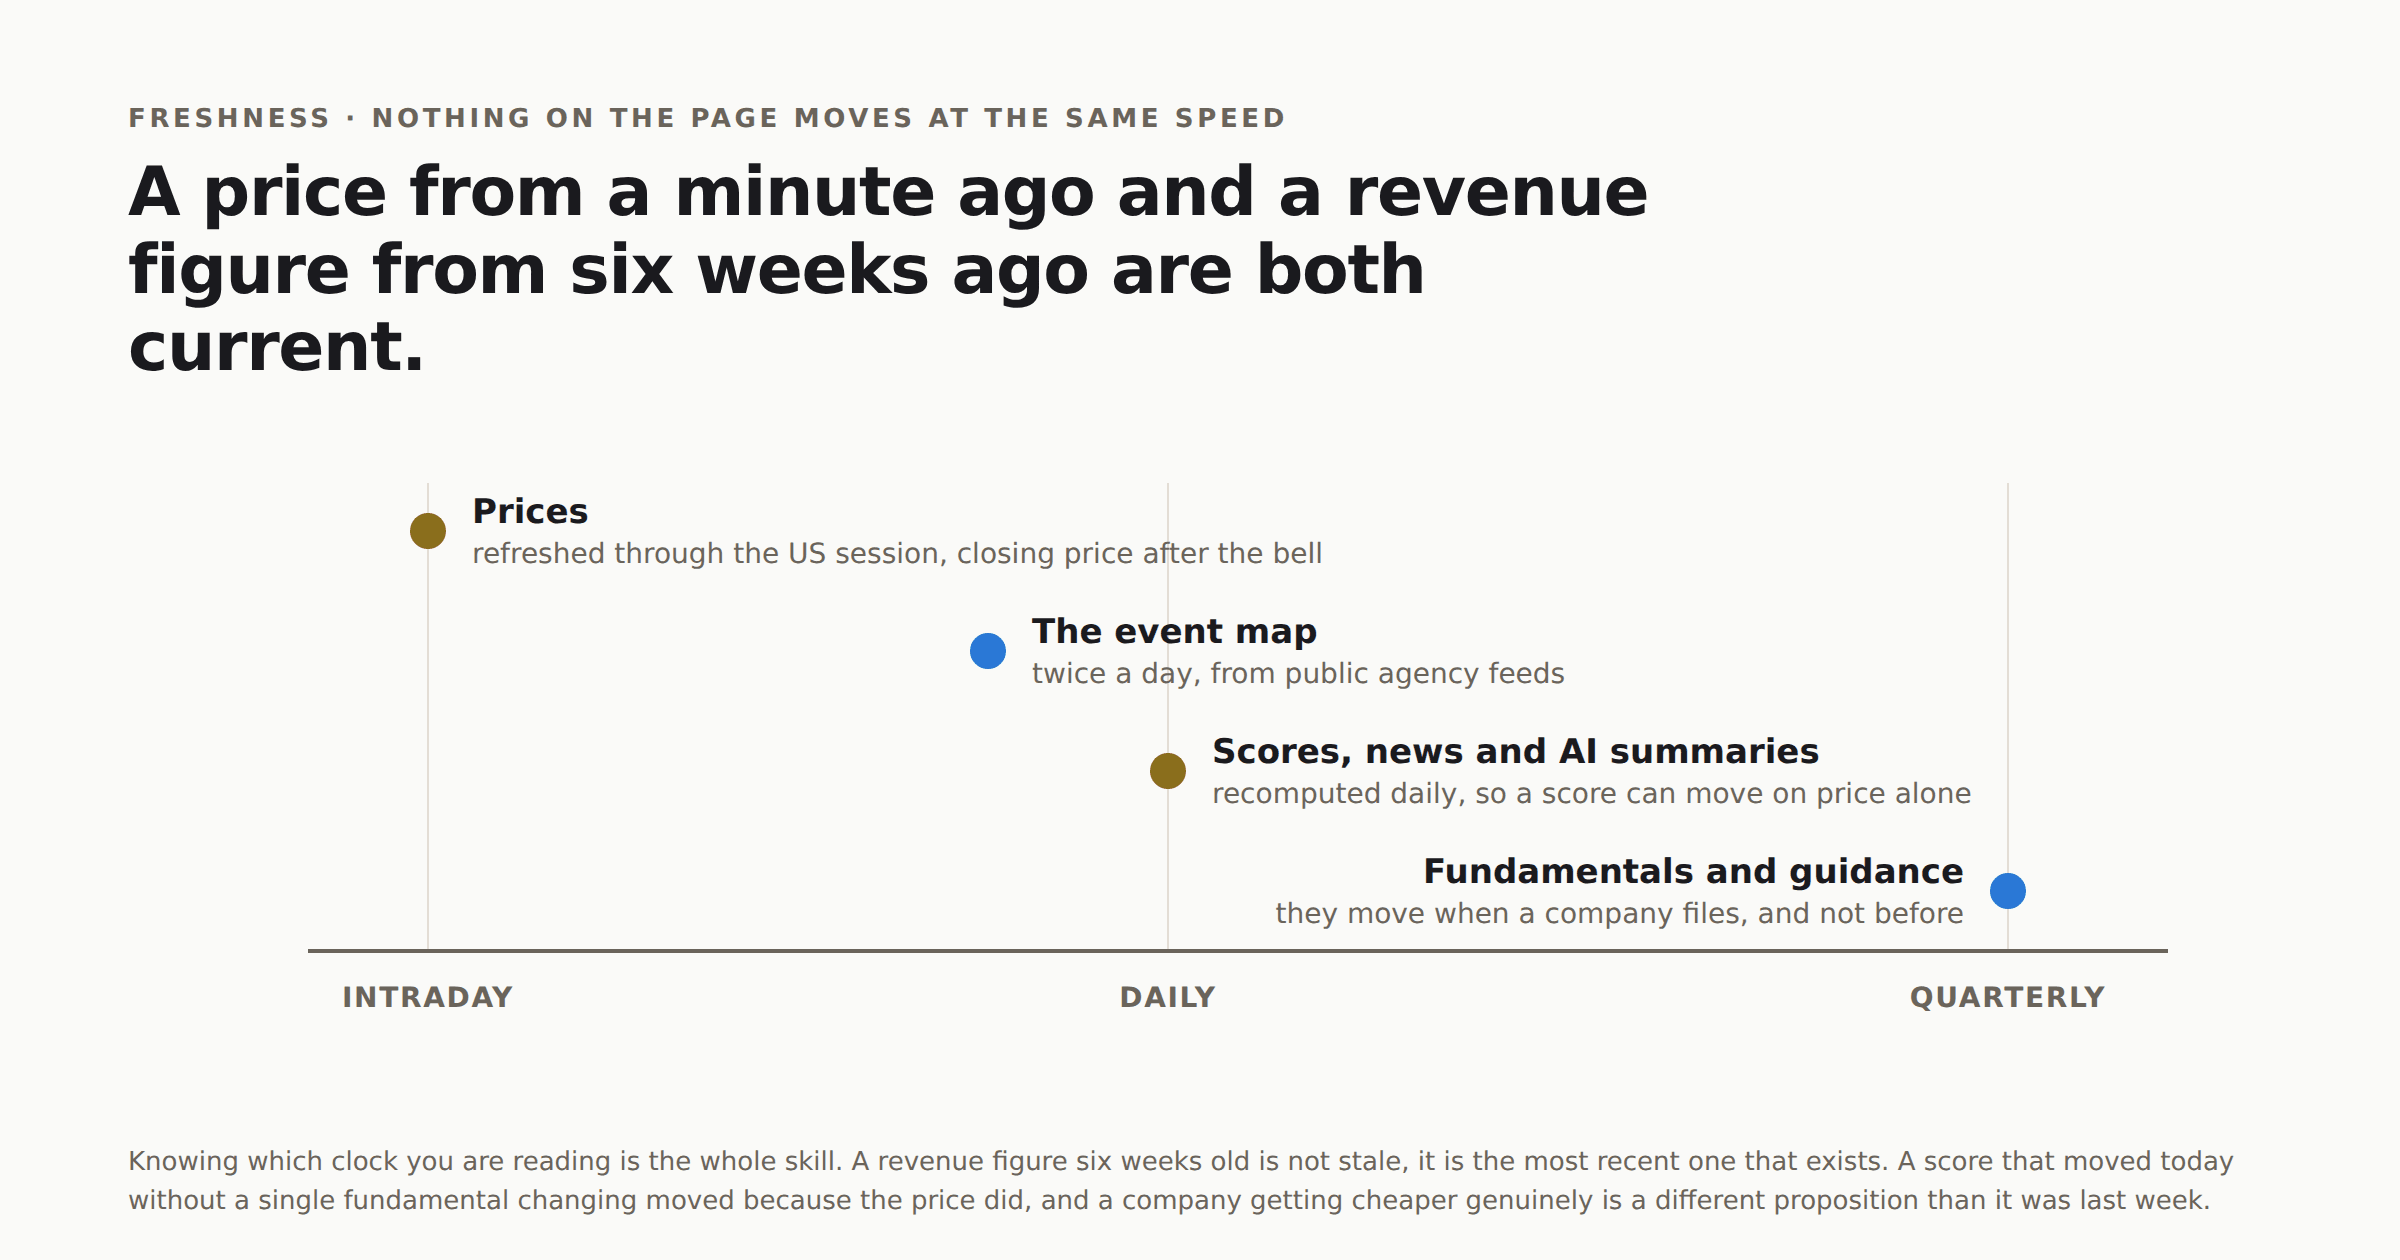
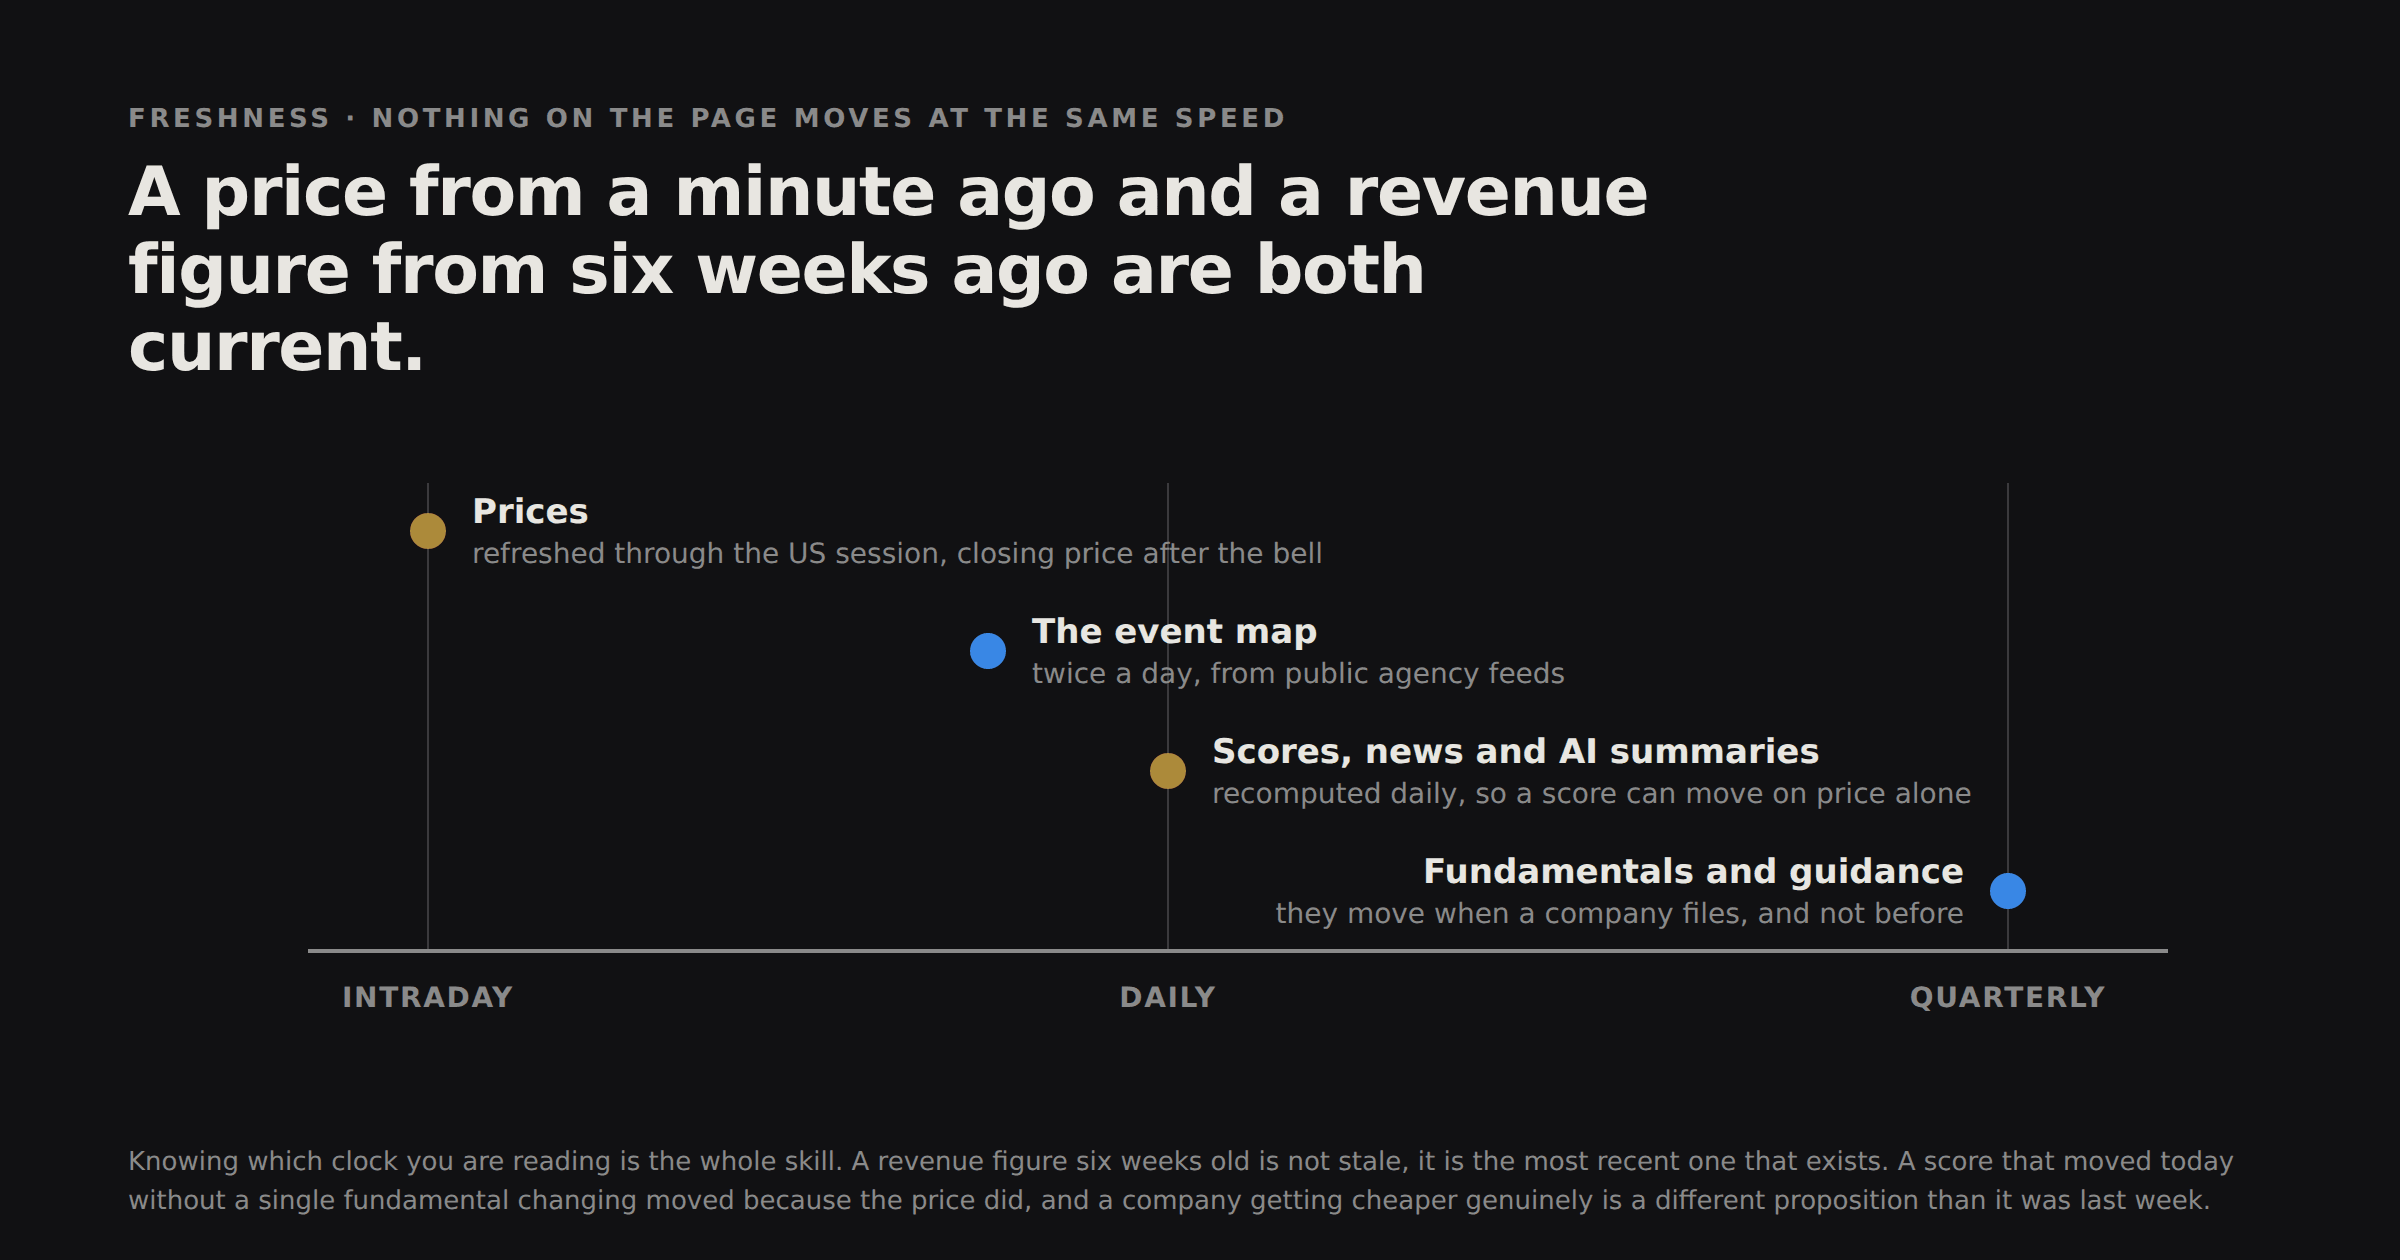
Different things on a company page update on different clocks. A price from twenty minutes ago sits next to a fundamental (a number from the company's own accounts) from six weeks ago, and a guidance figure (what the company said to expect) from last quarter. All three are current for what they are.
Knowing which clock you are reading is the difference between using this well and misreading it.
Prices
Refreshed repeatedly through the US trading day, with the closing price captured after the session ends. Not streamed, and never claimed to be.
Fundamentals
These move when companies file, which for most is four times a year. Between filings, a company's fundamentals do not change, so neither do ours. A revenue figure that is six weeks old is not stale; it is the most recent one that exists.
Scores
Recomputed daily. Because the score blends slow-moving fundamentals with a price-sensitive valuation pillar, a score can move day to day on price alone without a single fundamental changing. That is working as intended: a company getting cheaper is genuinely a different proposition than it was last week.
Point in time
Scores are computed from the data as it stood on the day, using what was actually available then. A filing that arrives tomorrow does not retroactively change yesterday's score. It is the same discipline the backtest runs on, and it is what makes the score history worth reading instead of being a rewritten story.
News, events and the world map
The event map refreshes twice a day and news on a daily cycle. Macro releases, the economy-wide numbers governments publish, land after their official publication. Scheduled events like earnings dates update as companies announce and revise them.
AI summaries
Each summary carries the time it was generated and expires after a period. When you open a company whose summary has aged out, a fresh one is written from current data. You never get an old summary presented as a current one.
What to check before relying on a number
Work out which clock a number is on before you lean on it. The score history chart shows you the trajectory rather than just today's value, which is usually the more honest read. If a figure matters to a decision, the filing it came from is public and it is the authority, not us.
One thing worth internalising
Fundamentals move on filings, not on news. If a company announced something an hour ago, the price may already reflect it and the fundamentals certainly will not. For anything that happened today, the news section and the company's own filings are ahead of everything else on the page.
Educational and proprietary. This explains what our research does, not the exact formula behind it, and it is not personalised investment advice. See the full disclaimer.
Was this page helpful?