
Methodology · · 8 min read
20.2% a year for thirteen years. Here is why you should not believe it yet
Ahead in 81 of 103 rolling five-year windows. Behind in seven of the thirteen calendar years. The stretch we sealed off went against us. Same argument.
Update, 12 September 2026
The figures in this post are the ones we measured in August 2026. We keep developing and backtesting the model, and the current record, with its measurement date, is on the backtest page. The argument below does not depend on the number.
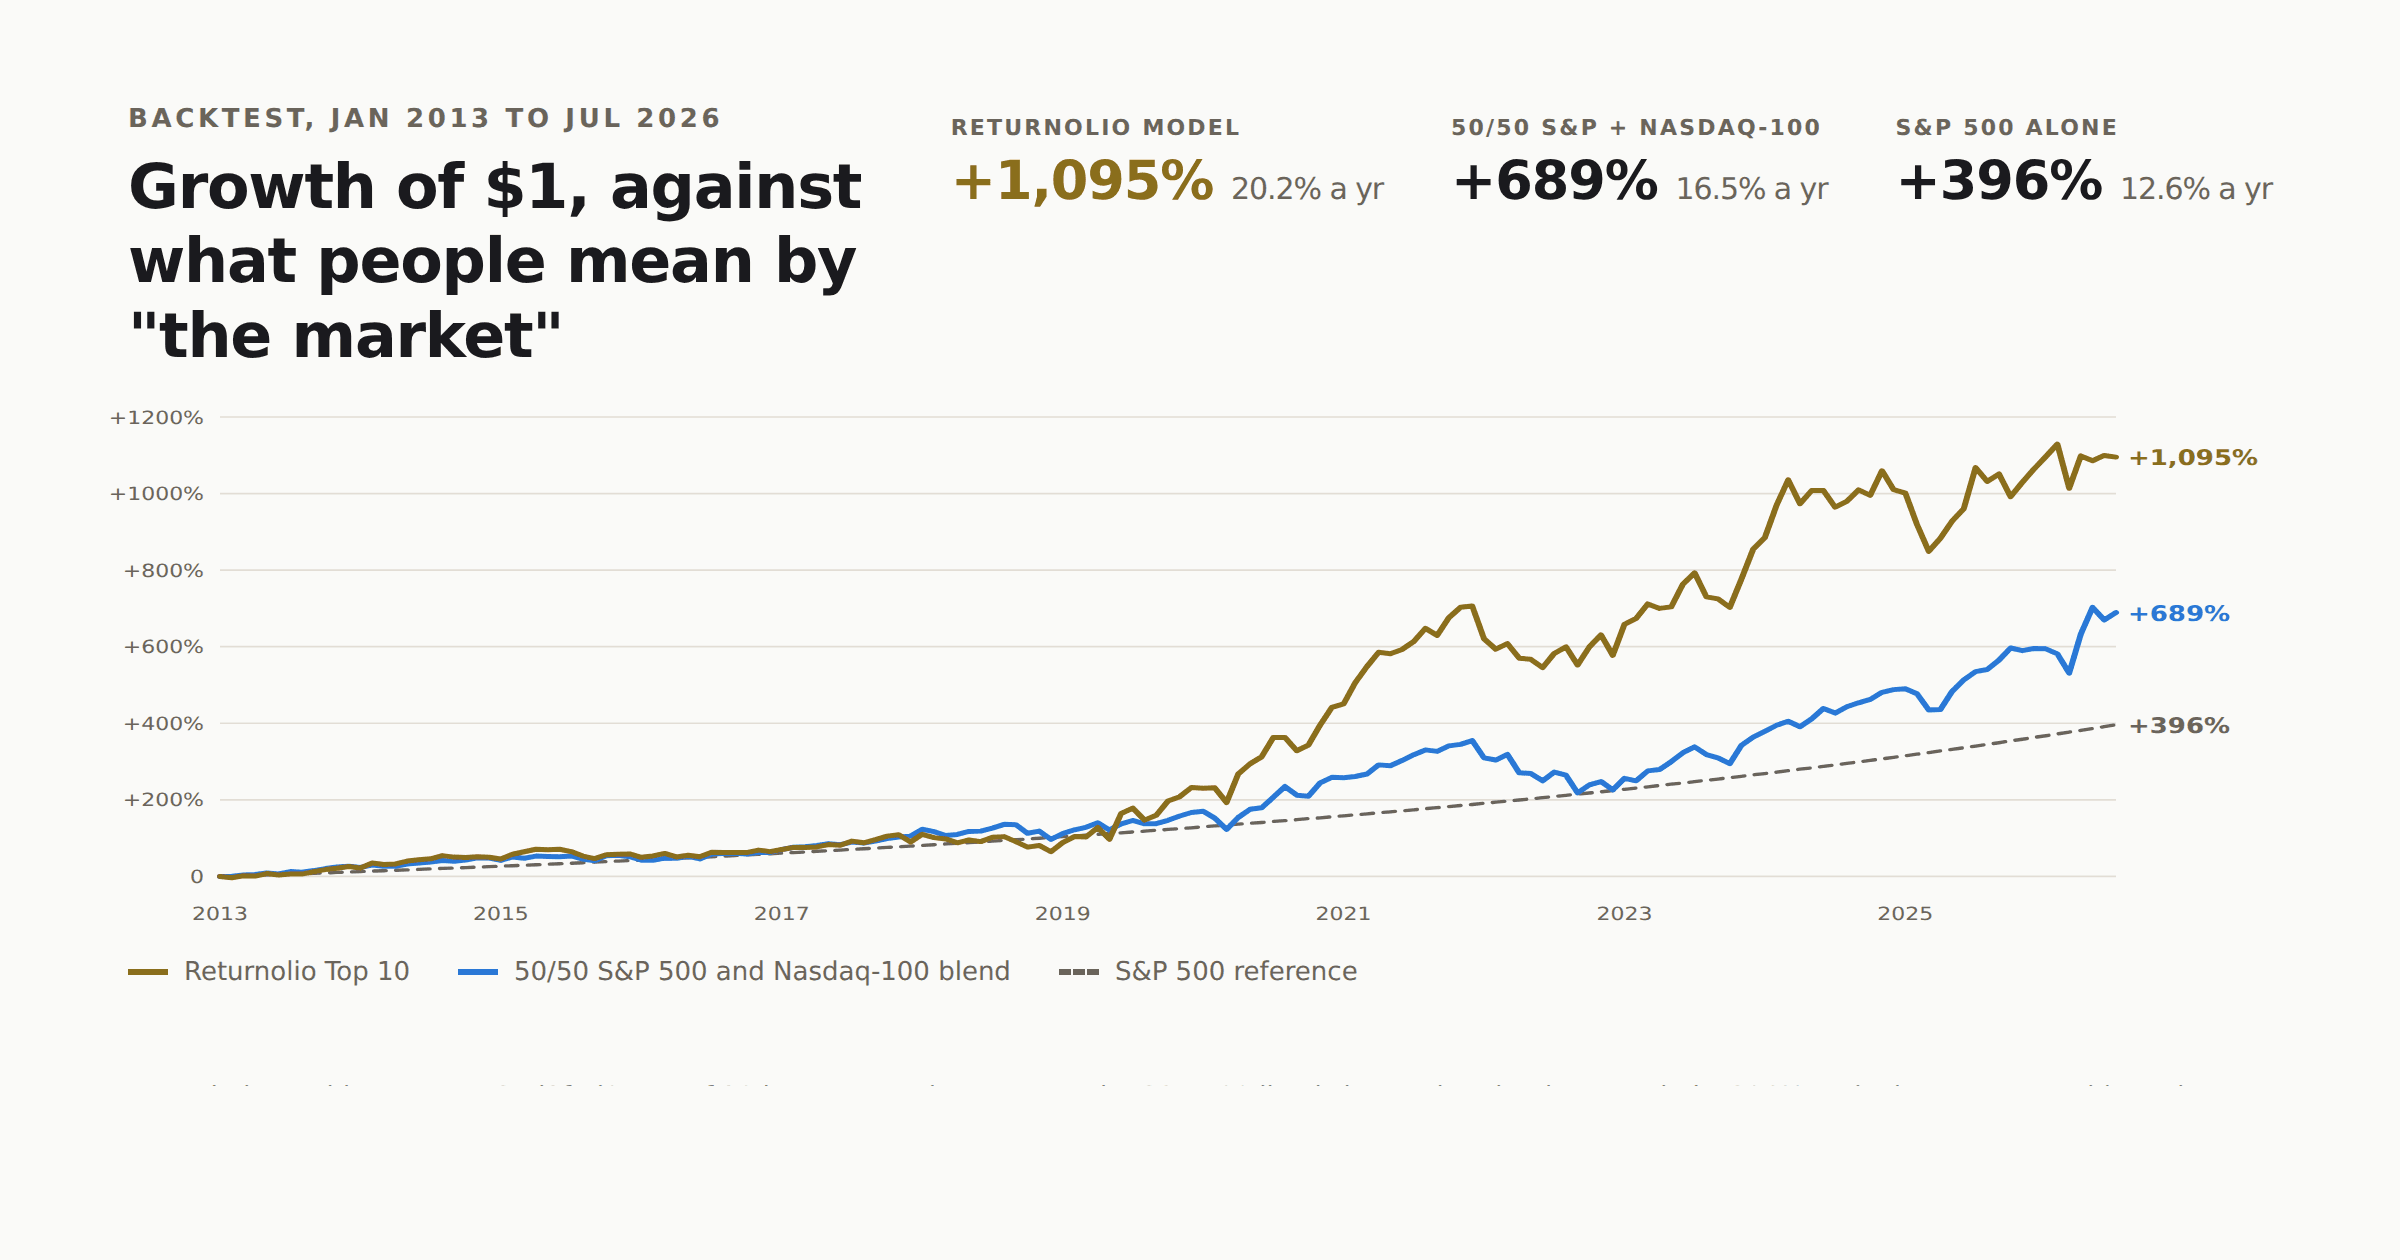
Thirteen years. The model was ahead of its benchmark in 81 of 103 rolling five-year windows, by a median of 8.1 percentage points a year, and compounded at 20.2% against the benchmark's 16.5%.
That benchmark is a 50/50 blend of the S&P 500 and the Nasdaq-100, which is worth saying out loud, because it is a harder bar than the S&P 500 that most products quote themselves against. The Nasdaq-100 was the better index over most of this period, and we are carrying half of it.
Against the S&P 500 alone, which is what almost everybody means when they say "the market", the same period runs +1,095% against +396%. Growth of one dollar into about twelve, against about five. We publish the harder comparison as the headline because it is the one that can be argued with.
You should not believe that. I would not believe it if somebody put it in front of me, because almost every backtest ever shown to anybody went up, and that is not evidence that strategies work. It is evidence that a backtest which went down never gets shown. The person who ran it ran a different one instead, and you only ever meet the survivor.
That filtering happens before you see anything, so no amount of squinting at the chart will catch it. The only defence is a test built to be hard to flatter, published whole, including the parts that are unflattering.
So here is the whole thing.
First: it is not thirteen years because thirteen is a long time
This is the question I get asked least and should be asked most.
The window was not chosen for its length. It was chosen for what is inside it, and what is inside it is nearly every market condition of the modern era:
- The long pre-COVID bull market
- A high-inflation shock, and then the high-rate environment that followed it
- Growth leadership, and then the rotation into value that ended it
- A crypto boom, with everything that did to risk appetite
- Bond yields high enough that equities had actual competition
- An inverted yield curve
- A technology boom in which the index mostly rose because seven companies did
- Several short recessions, and several bull markets
A ten-year test that happens to sit inside one regime tells you the model suits that regime. It tells you nothing about the next one. This period was picked because it contains the disagreements: stretches where quality won and stretches where it was punished, stretches where cheap worked and stretches where cheap was a trap.
It is a designed test, not a long one. That distinction is most of why the number means anything at all.
Second: the lie a backtest tells by default
The most common way a backtest flatters a model has nothing to do with dishonesty. It is look-ahead bias, and the default settings of most data sources hand it to you for free. The full method, including how every score was pinned to the date its filing actually became public, is written up in the backtest methodology.
A company's first-quarter results cover January through March. They are filed in, say, early May. A dataset that files those numbers under "Q1" will cheerfully let a model score that company in January using figures that did not exist until May.
The model looks prescient. It is not. It has been handed next quarter's homework. And because it applies to every company in every quarter, it is not a rounding error: it amounts to systematically buying the things that were about to report well, which is a strategy nobody alive can run.
So every fundamental figure in this test is dated to the day the filing actually reached the SEC, not to the period it covers. 12,038 filing dates were pulled from EDGAR to make that possible. In any given month the model sees exactly what the market saw that month, and nothing else.
This is the single most expensive decision in the whole test, and it makes the result worse. On purpose. A point-in-time test always looks worse than the same strategy run on period-stamped data, and the gap between those two numbers is the size of the lie you would otherwise be telling yourself.
Third: the seven years
Over the thirteen years the model was behind the passive blend in seven calendar years. 2013, 2016, 2017, 2018, 2023, 2024 and 2025. The worst was 2018, about nine points back.
The rolling five-year picture is the one that matters more, because nobody holds anything for exactly one calendar year: 81 of the 103 windows were ahead, and 22 were behind, clustered around windows ending in 2018 and 2019. Five years is longer than almost anybody's patience, and roughly one window in five still finished behind.
And the one stretch that was sealed off, so it could never be tuned against, went against us: 2022 to mid-2026, 10.7% a year against 15.0% for the blend.
I publish that list, and I want to be clear that it is not modesty. It is the most persuasive thing on this page. Anyone can show you a line that goes up. Naming the specific years it went down is expensive, it is checkable, and it is the one thing a model with something to hide will never do. If you find another scoring product that names its losing years, take that product seriously. There are not many.
There is a second reason, which matters more if you are actually going to use this.
Peter Lynch's real problem was never the picking
Peter Lynch ran Fidelity Magellan from 1977 to 1990 and compounded at roughly 29% a year, which is about as good as a public equity record gets.
He spent much of the rest of his career pointing out that the typical investor in his own fund did considerably worse than the fund did. Not because of fees and not because of tax. Because they bought in after a good stretch, when the returns in the brochure looked best, and sold during a bad one, when holding felt stupid.
The strategy was never the hard part. Living inside it was.
That is precisely what the seven years are for. If the only thing you ever see is a smooth curve, then the first bad year feels like something has broken, and you sell into exactly the drawdown the record says is normal. Knowing in advance that this thing spends whole years behind the index is not a disclaimer. It is the operating manual.
What the published Top 10 adds, and why the number does not cover it
One more thing, because it would be a poor sort of transparency to leave it out.
The backtest is strictly mechanical. Ten names, equal weight, reviewed monthly, swap only on a clear conviction margin, no more than four from one sector, no leverage, no shorts, and no human touching it at any point. It has to be mechanical, because a backtest with judgement in it cannot be argued with: whatever it returns can be explained afterwards by the judgement, so it proves nothing.
The Monthly Top 10 that subscribers receive is that rule plus one review step, and names do get taken off the list by hand. How the list is put together sets out the mechanical part.
The clearest case is news that has already moved a price while the financial statements have not caught up. The company announces something good, the market reprices it that afternoon, and the model is left comparing a new price against old filings. The filings will probably catch up. That is exactly what makes it a poor entry today, and the model cannot see it, because the thing it would need to read has not been filed yet.
So the 20.2% belongs to the mechanical rule. It does not belong to the published list, which has a shorter history and a person in it. Both are disclosed every month, which means you get to watch the difference rather than take my word for which one is better.
The honest summary
The result is real and it is hypothetical. No money was invested during the test period, so this is a rigorous simulation on real historical data, not a track record, and past performance does not guarantee anything about the future.
Within those limits: the test was built on real filing dates, designed across eight distinct market regimes, sealed against its own tuning, and published with every losing year named.
There is a version of this page with one number on it and no seven years. It would probably convert better this week. It would also be the first thing a careful reader stopped trusting, and careful readers are the only people this product is any use to.
Educational and proprietary. This explains what our research does, not the exact formula behind it, and it is not personalised investment advice. See the full disclaimer.
Read next

7 min read
A low P/E is not a discount. It is a forecast, and often a correct one
Screen for the cheapest companies and you get businesses the market expects to earn less next year. What breaks when the multiple is your only filter.

6 min read
I made a year's salary in one day. Then I gave it all back
How a windfall, a bankruptcy and a lot of expensive tuition turned into a scoring model. The short version: every rule in it is a mistake I already paid for.

6 min read
Home Depot earned 110% on equity last year. Nobody earns 110%
Return on equity rises when a company buys back stock, and keeps rising after the equity is gone. Return on invested capital cannot be moved that way.