Returnolio

Sample report · AMZN

One Stock Deep Dive, in full.

The report we ran on Amazon.com, Inc. on 16 September 2026, every page of it, with a note on what each page is and whose number it shows.

This report is a snapshot. Here is when each part was taken.

A number is only as good as its date. These are the report's, so you can judge every figure below against the calendar before you judge it against anything else.

Captured
16 September 2026, from the live product, the pages a subscriber sees.
Latest results in it
The quarter to 30 June 2026, reported 30 July 2026, 10-Q filed with the SEC on 31 July 2026.
Our fundamentals table
Refreshed for AMZN on 16 September 2026.
Price
$253.54, the close of 14 September 2026, from our own weekly closes.
Next results due
29 October 2026.

The pages, in the order they arrive.

The label on each page says whose number you are looking at: the company's, as filed; ours, computed from those filings; a model's; or somebody else's.

  1. Page 1Company record

    The company, in plain terms

    Before any score: what this business actually is and where the money comes from.

    A plain description of the business, from our company record. No view in it.

    Amazon.com, Inc. operates a vast global retail enterprise, distributing consumer goods and subscription services through both its extensive online platforms and a network of physical stores across North America and internationally. Its operations are structured into three primary segments: North America, International, and Amazon Web Services (AWS). The company's product offerings encompass both merchandise and content procured for direct resale, alongside items sold by third-party merchants on its platform. Furthermore, the company develops and markets its own range of electronic devices, such as Kindle e-readers, Fire tablets and TVs, Ring, Blink, eero, and Echo products. It also invests in the development and production of original media content. Amazon provides various programs designed to enable independent sellers to offer their products, and empowers authors, musicians, filmmakers, Twitch streamers, and app developers to publish and commercialize their content.

    Run by Andrew R. Jassy, with 1,560,000 employees.
  2. Page 2Our list

    Is it in our Top 10?

    The question everyone asks.

    Membership of our published Top 10.

    AMZN was not in the July 2026 Top 10. We publish ten names a month, equal weight, and we hold all ten with our own money. Whether AMZN made a newer edition is in the current one.

  3. Page 3Market data

    The price, this year

    Where the market has priced AMZN over the last year; the rest of the report is about whether that price is deserved.

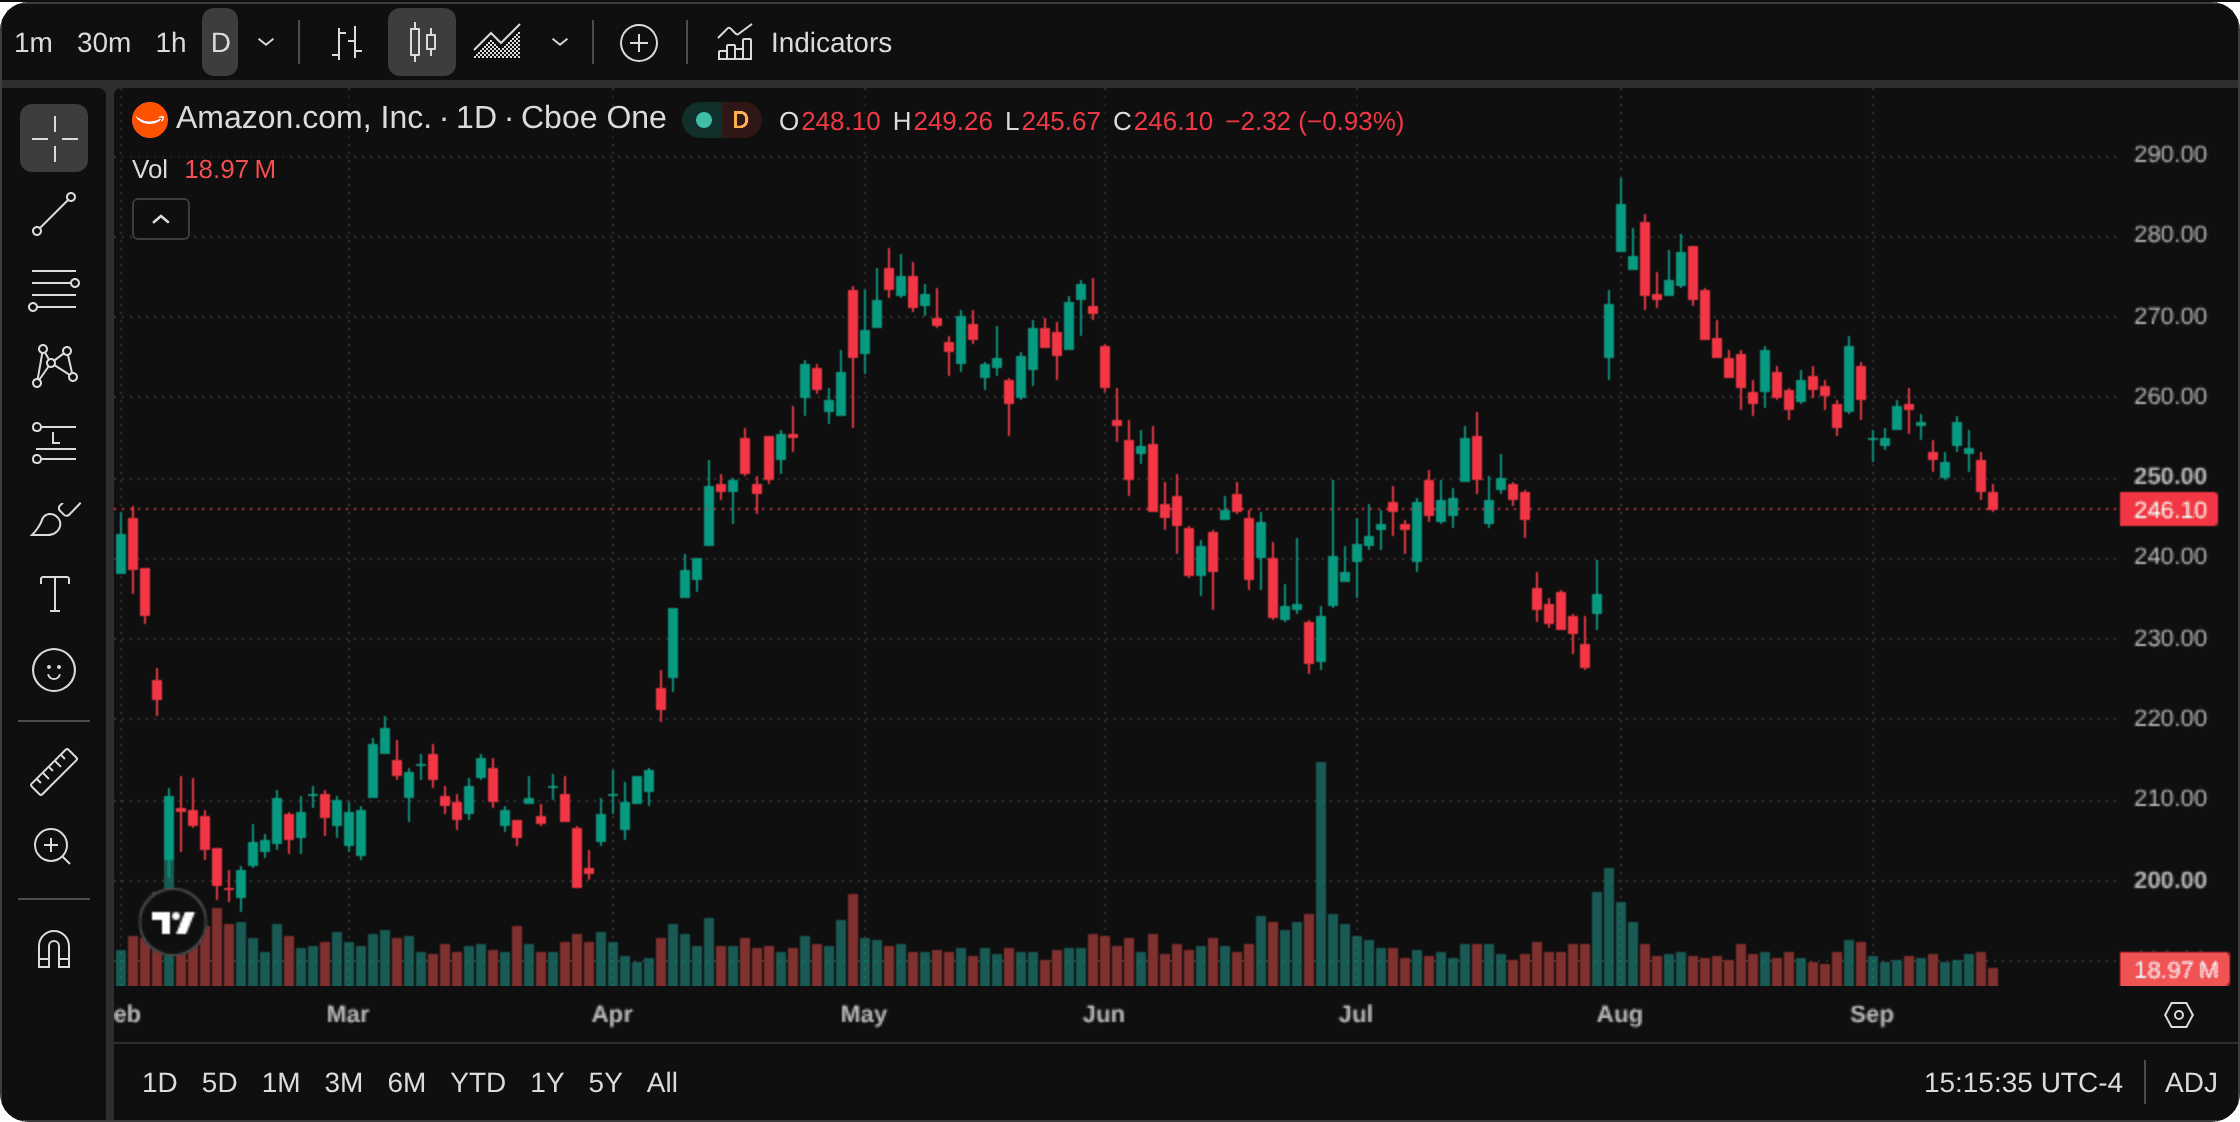
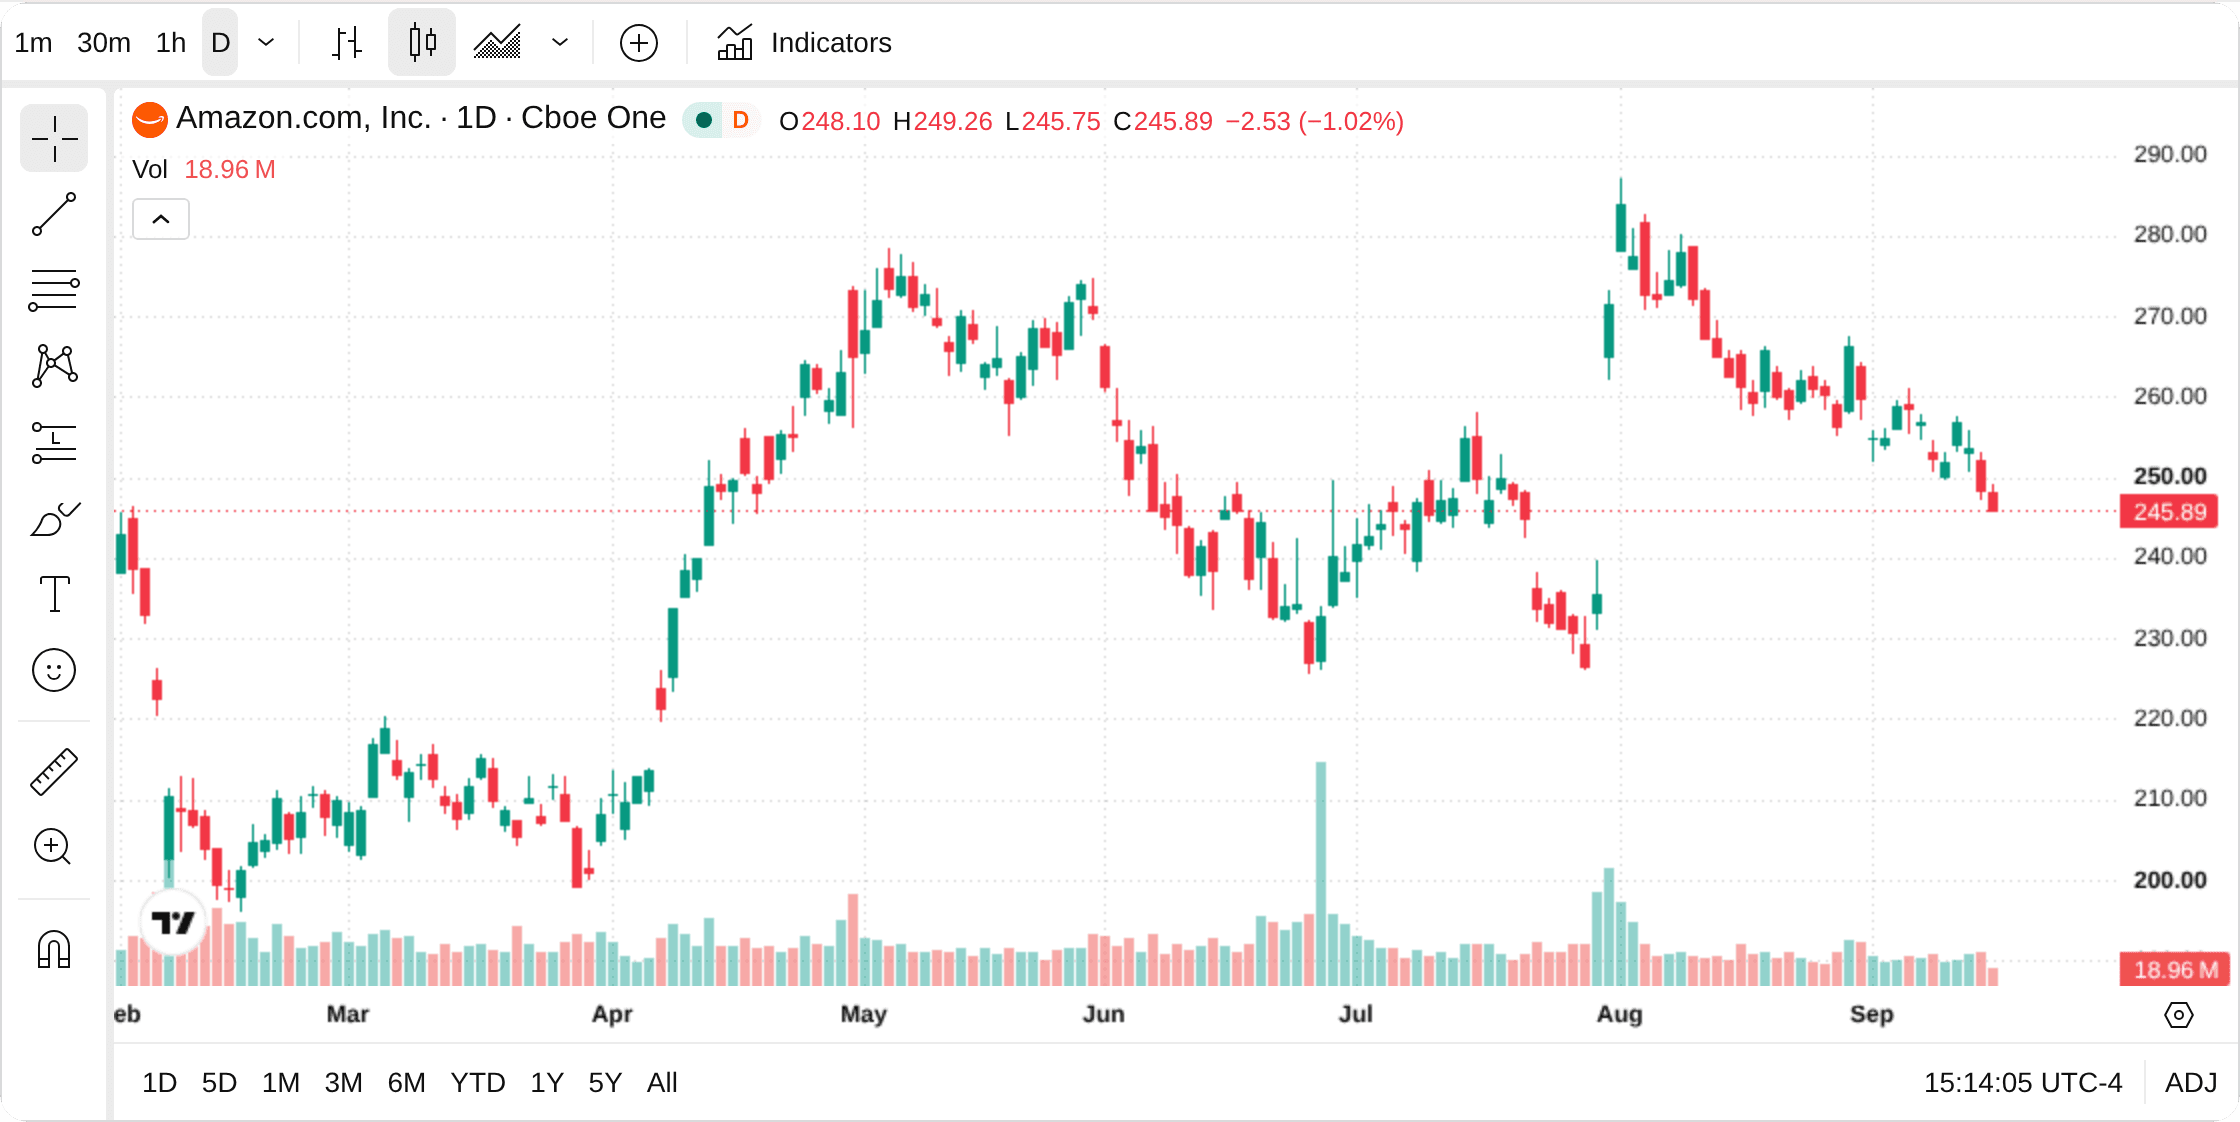
    Prices. The chart is TradingView's; the figures are our weekly closes.

    Last close $253.54, the close of 14 September 2026. This year +9.0%, since the last close of 2025. 52-week range $198.79 to $284.02, weekly closes.

    A one-year price chart of AMZN from TradingView, ending at the close of 14 September 2026.
  4. Page 4Our model

    The Returnolio Score

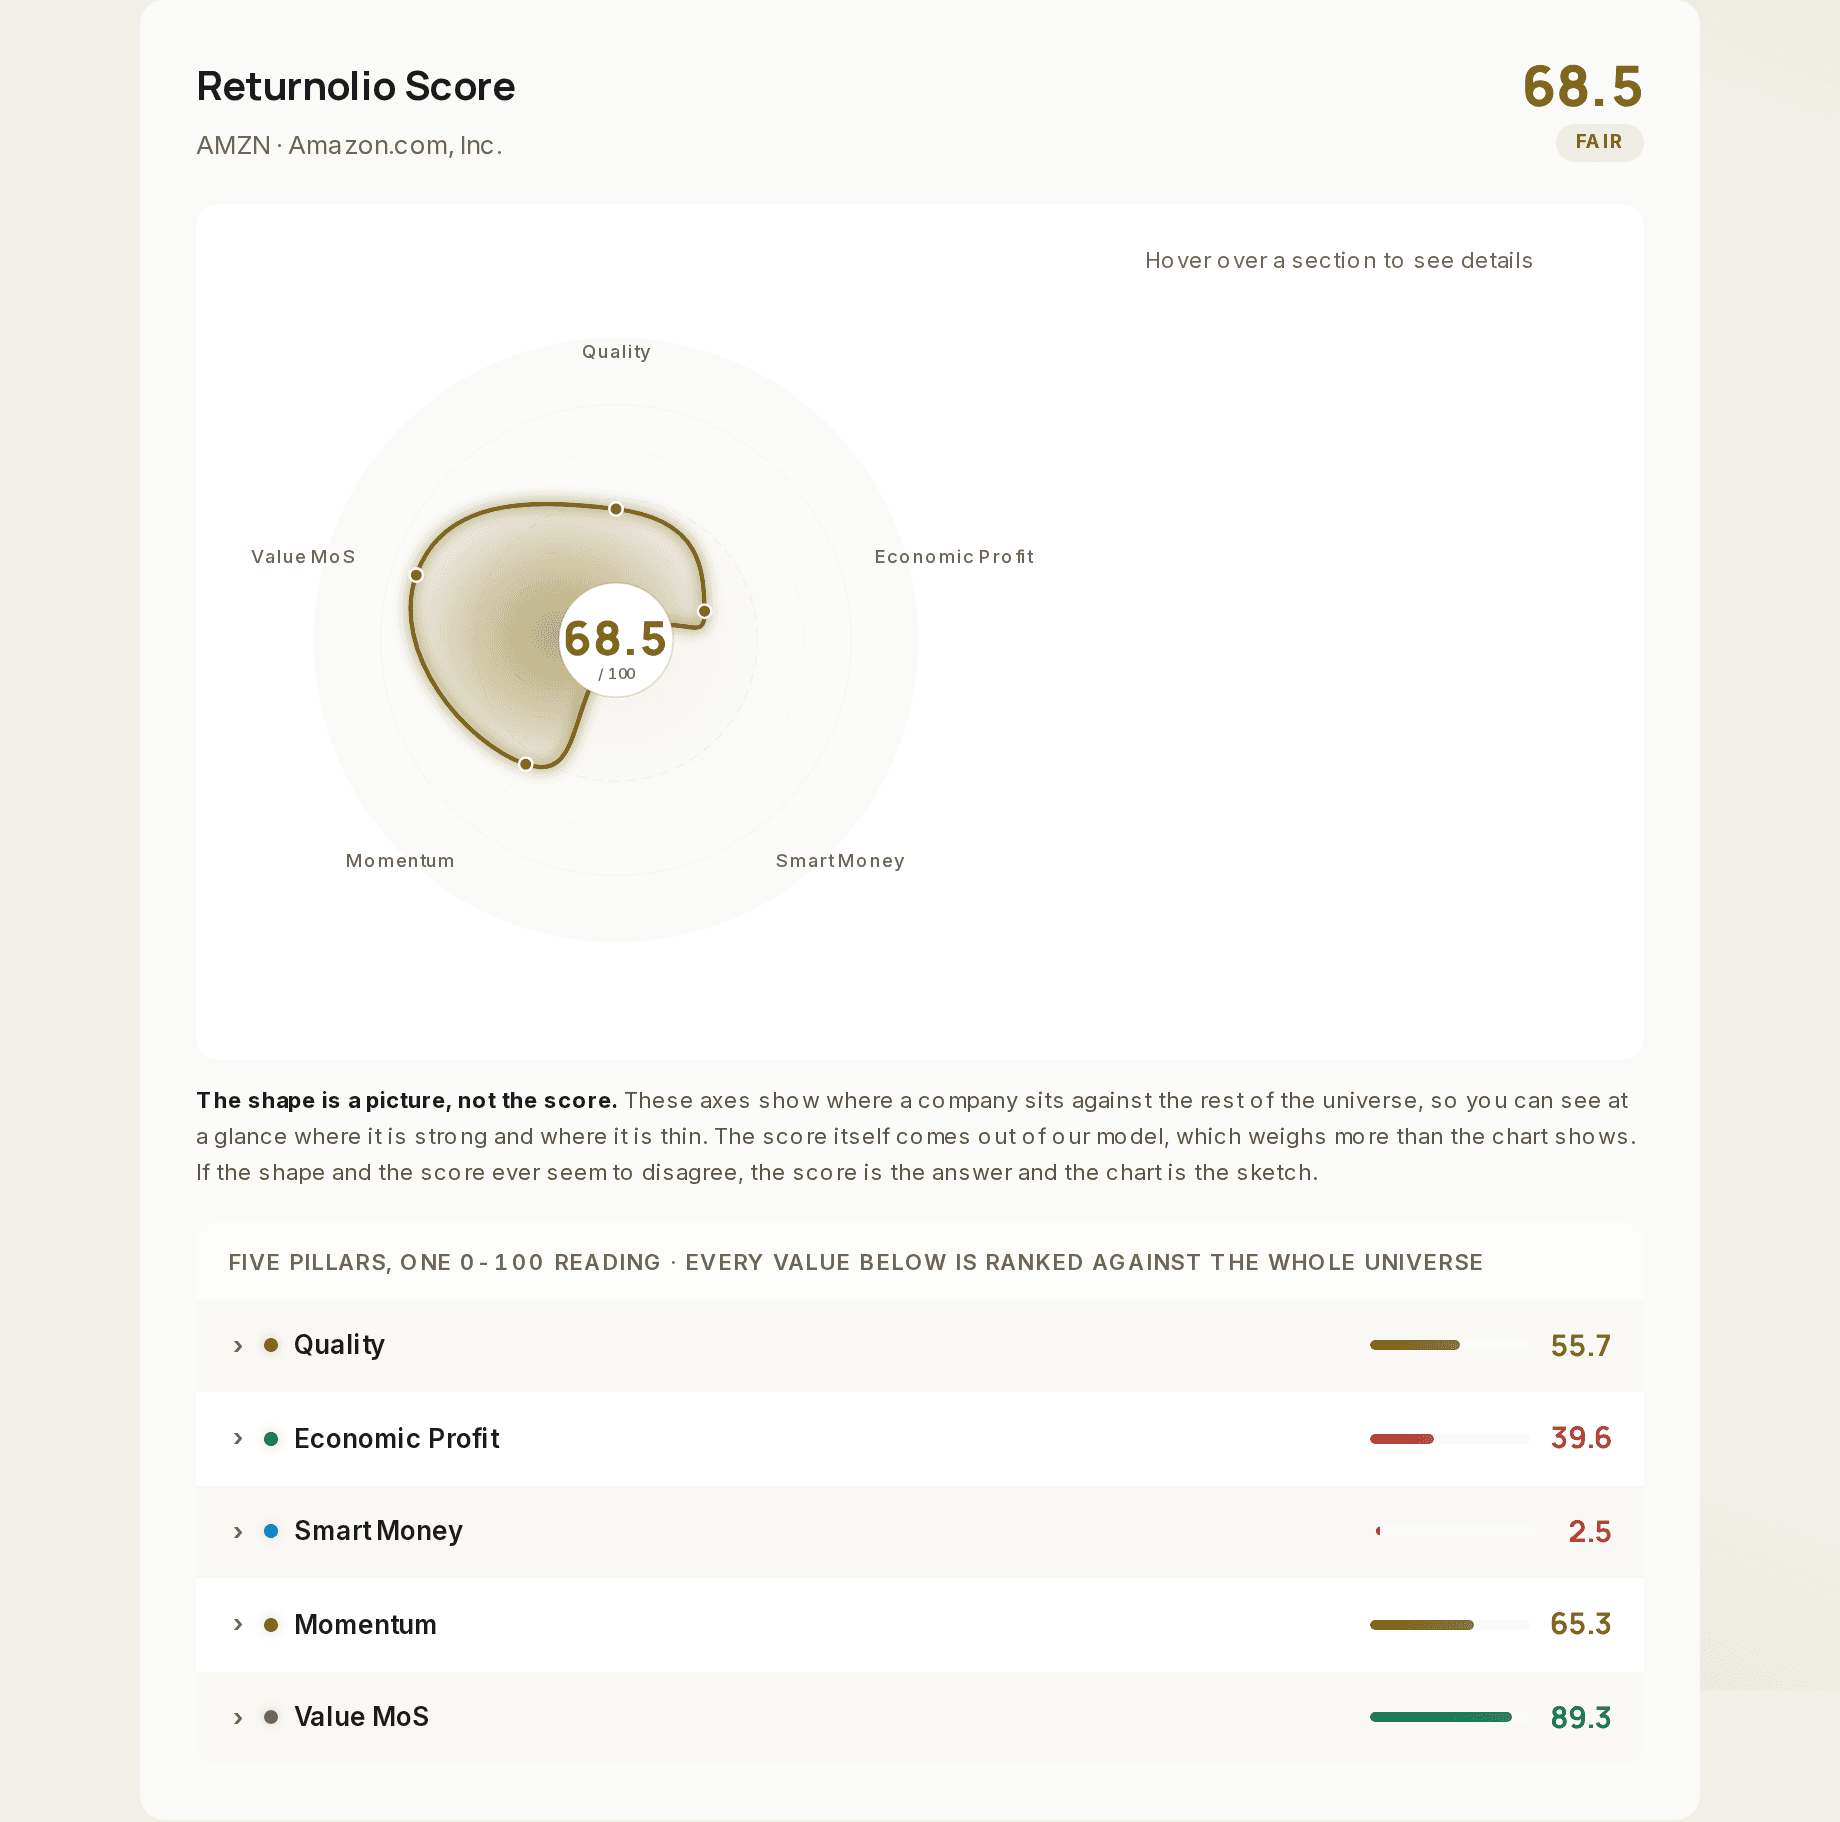
    One number from 0 to 100, and the five pillars under it, each ranked against everything we cover.

    Computed by us from filed figures and prices. Ranked against the whole universe.

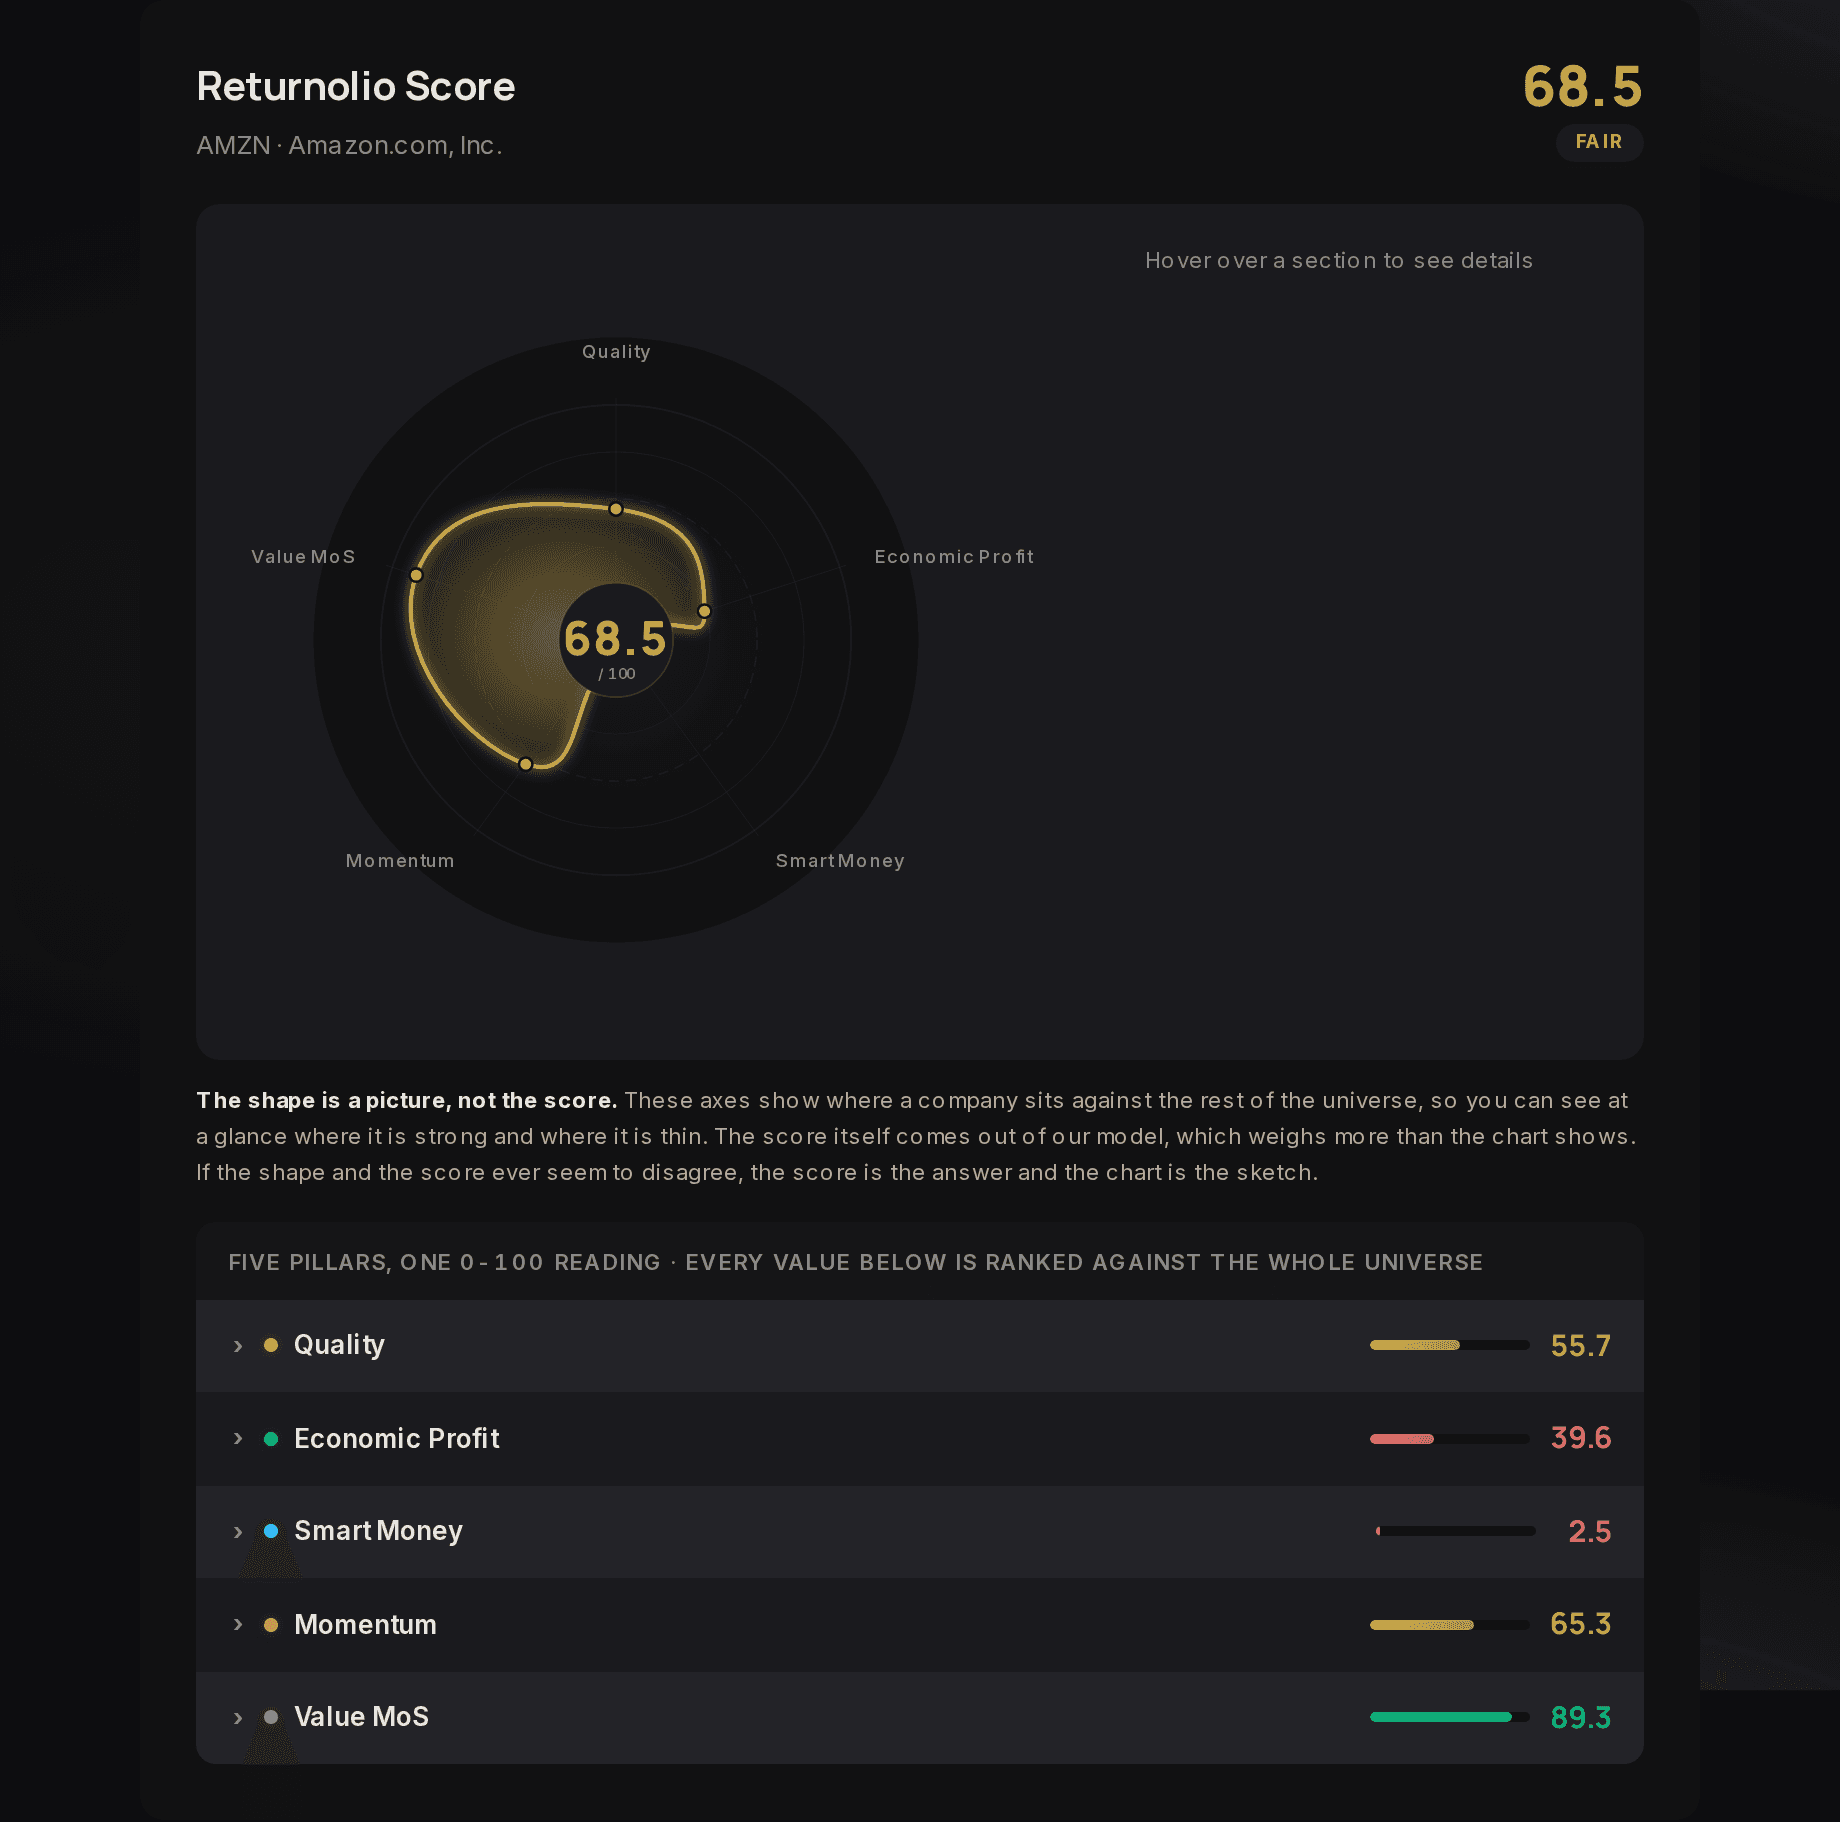
    The Returnolio Score card for AMZN: 68.5 out of 100, rated Fair, with a five-axis shape and the pillar readings Quality 55.7, Economic Profit 39.6, Smart Money 2.5, Momentum 65.3 and Value MoS 89.3.

    How to read it. 68.5 is the reading on 16 September 2026. It moves as filings and prices land, so the live page will not say 68.5 for long. The shape is a picture of where the company is strong and thin; the number is the answer.

  5. Page 5Our model

    The score, taken apart

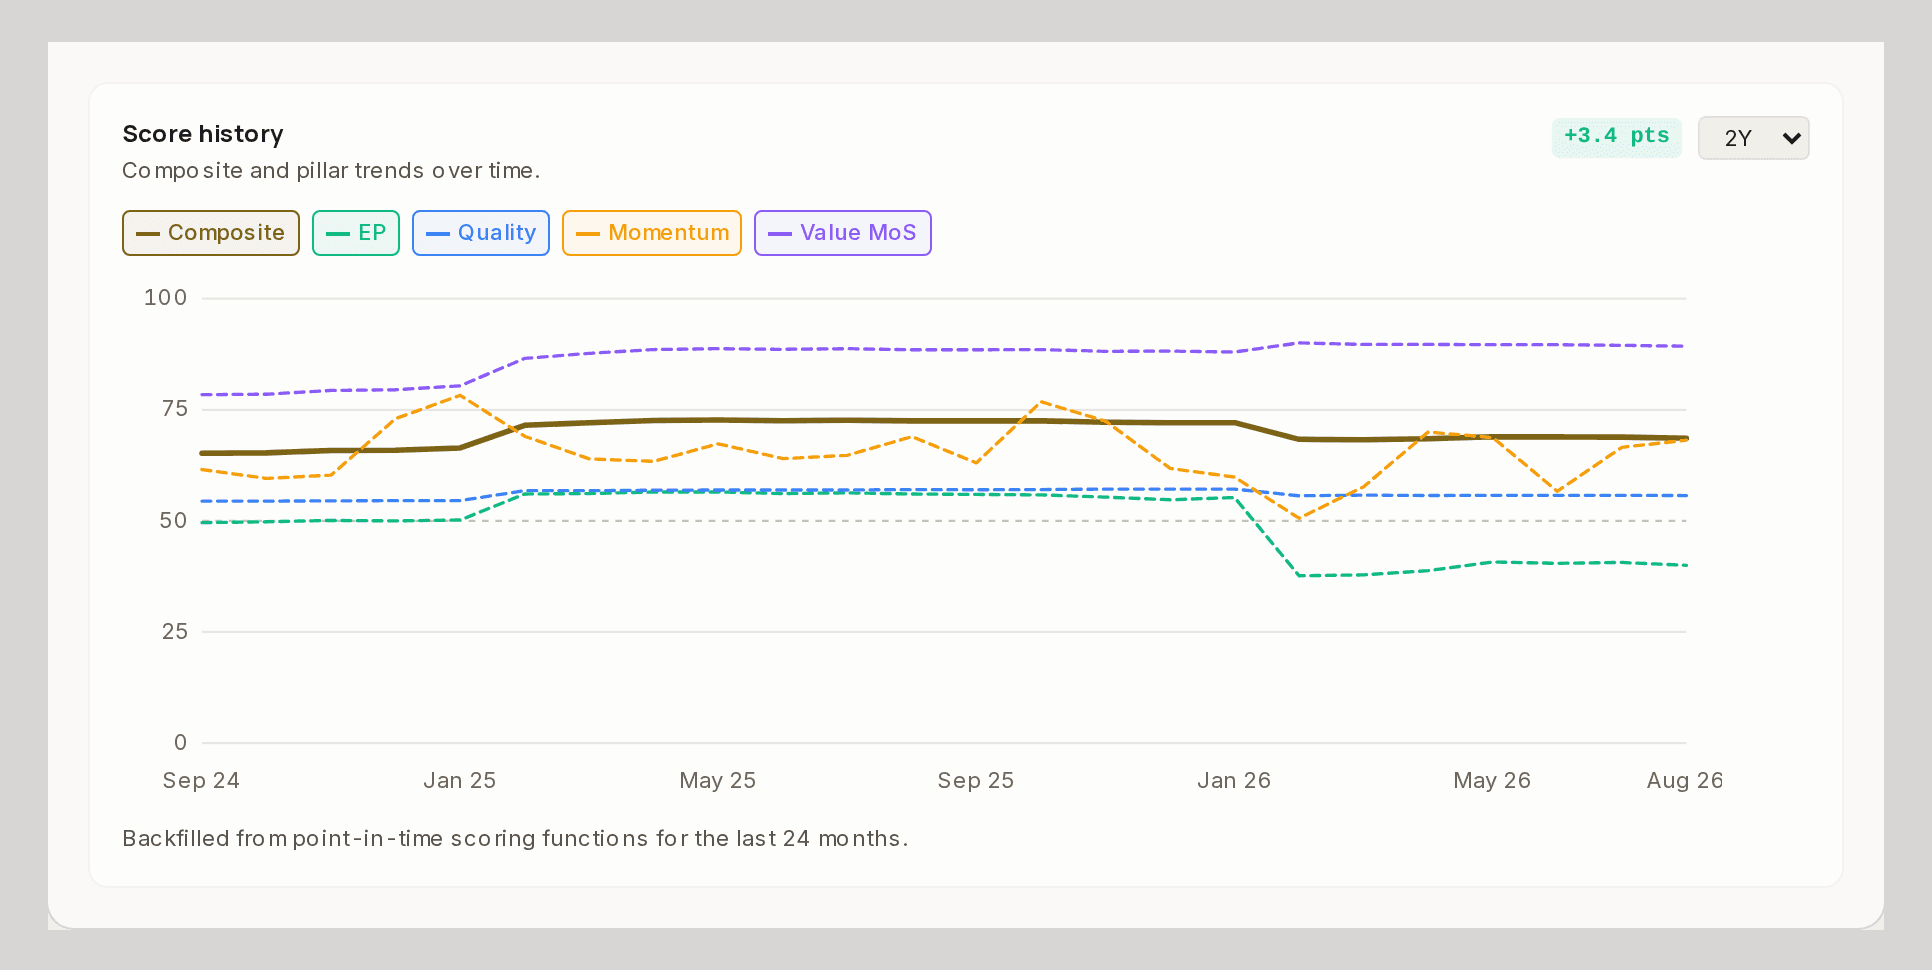
    Each pillar's sub-readings by name, and how the readings have moved over two years.

    Computed by us from filed figures and prices. Ranked against the whole universe.

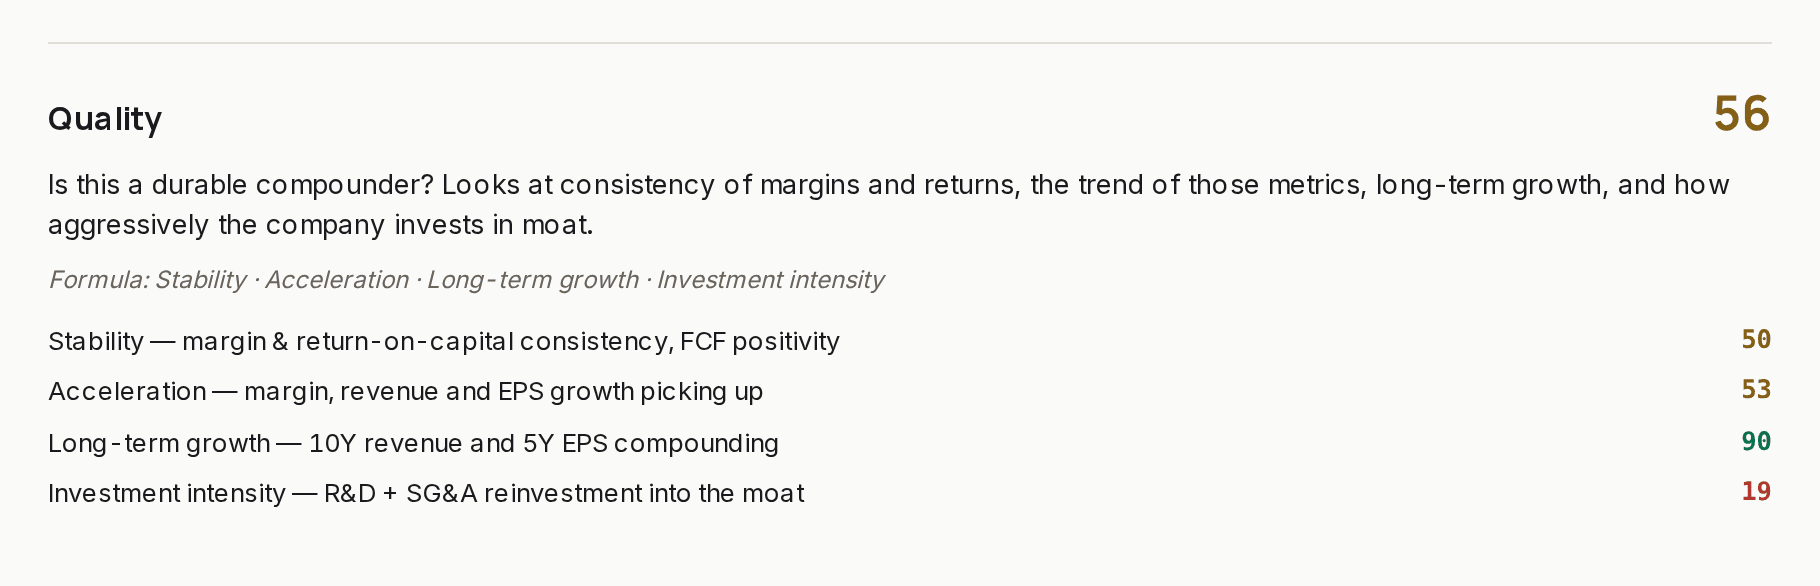
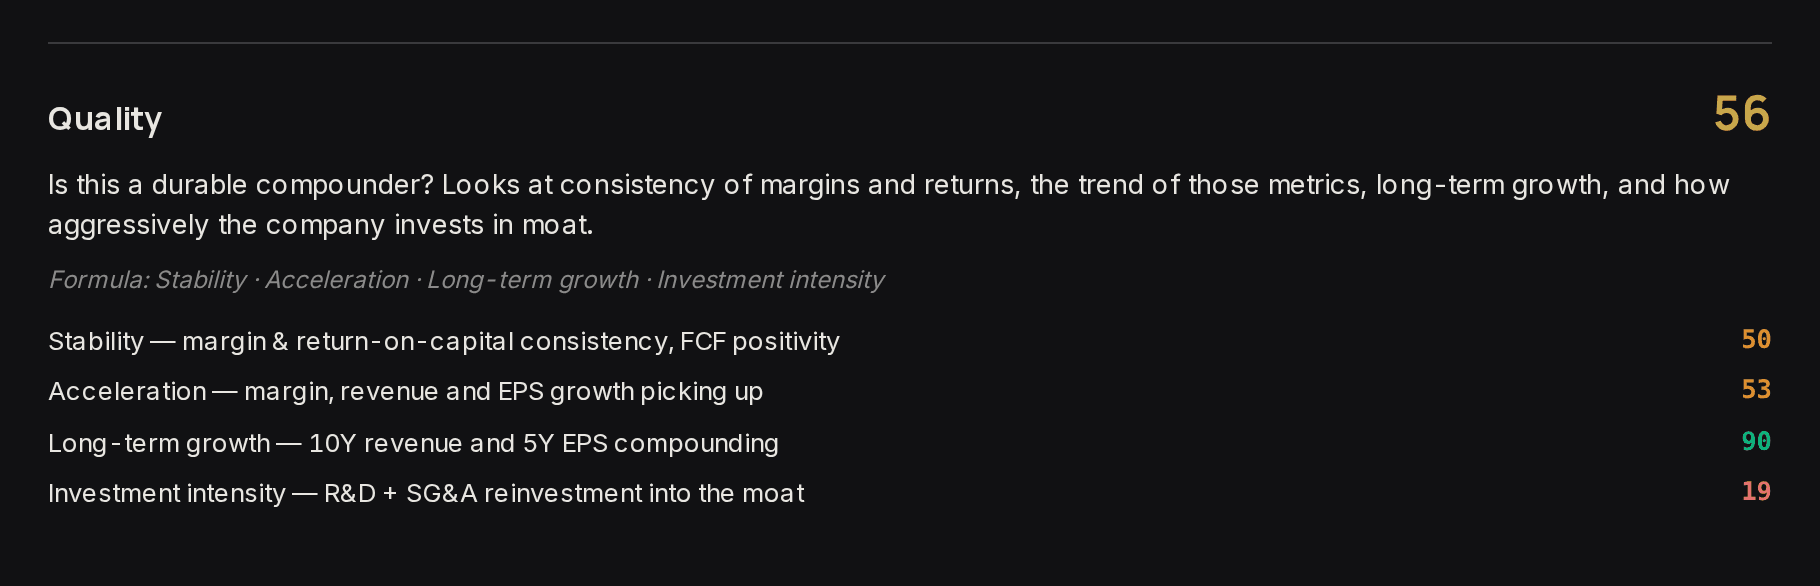
    Quality pillar, reading 56: stability 50, acceleration 53, long-term growth 90, investment intensity 19.
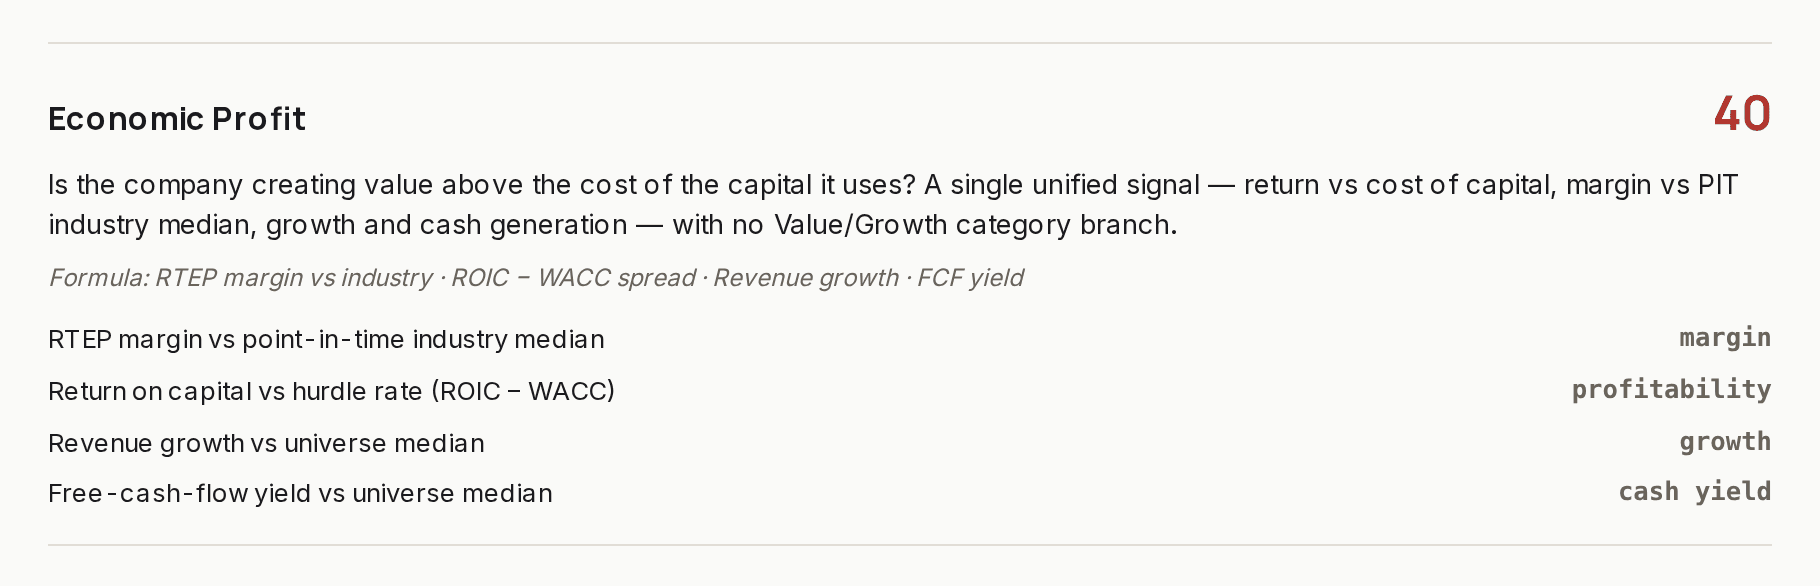
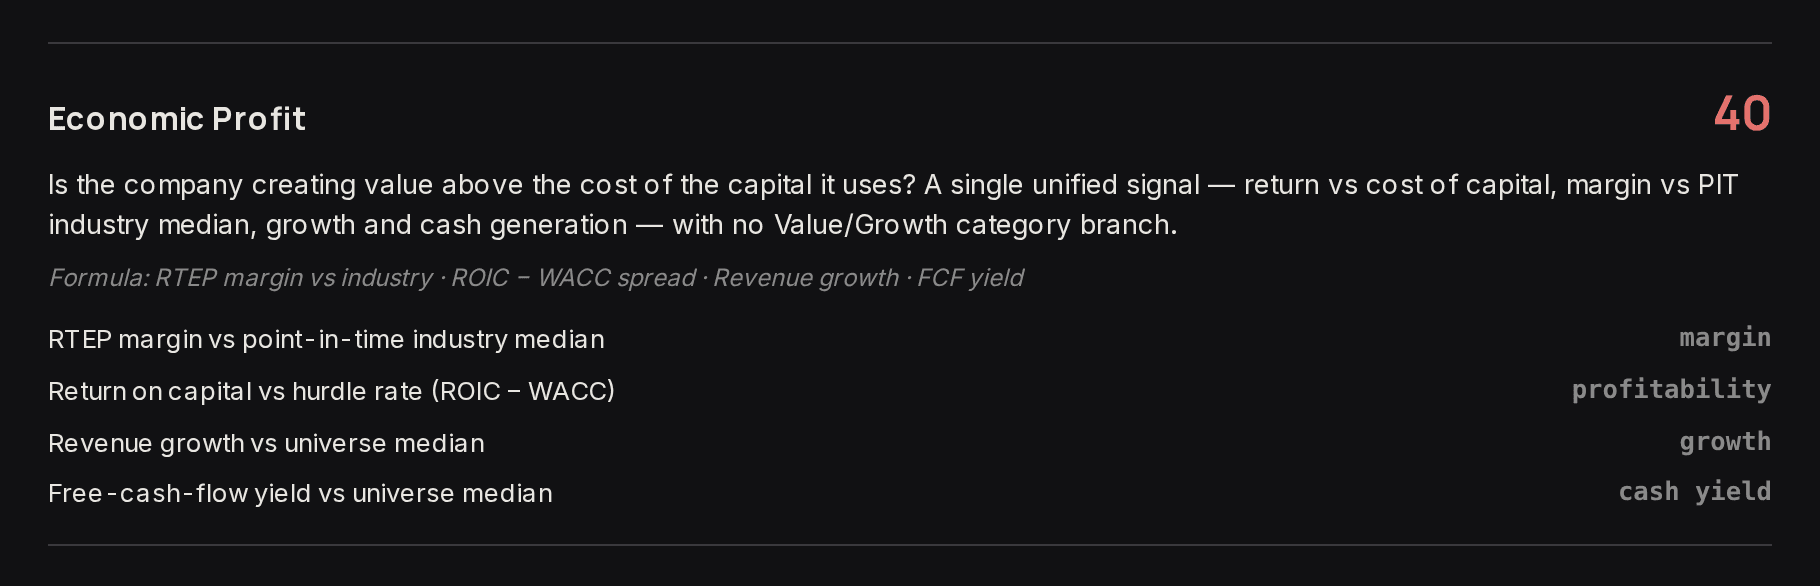
    Economic Profit pillar, reading 40: RTEP margin against the industry median, return on capital against the hurdle rate, revenue growth and free-cash-flow yield against the universe median.
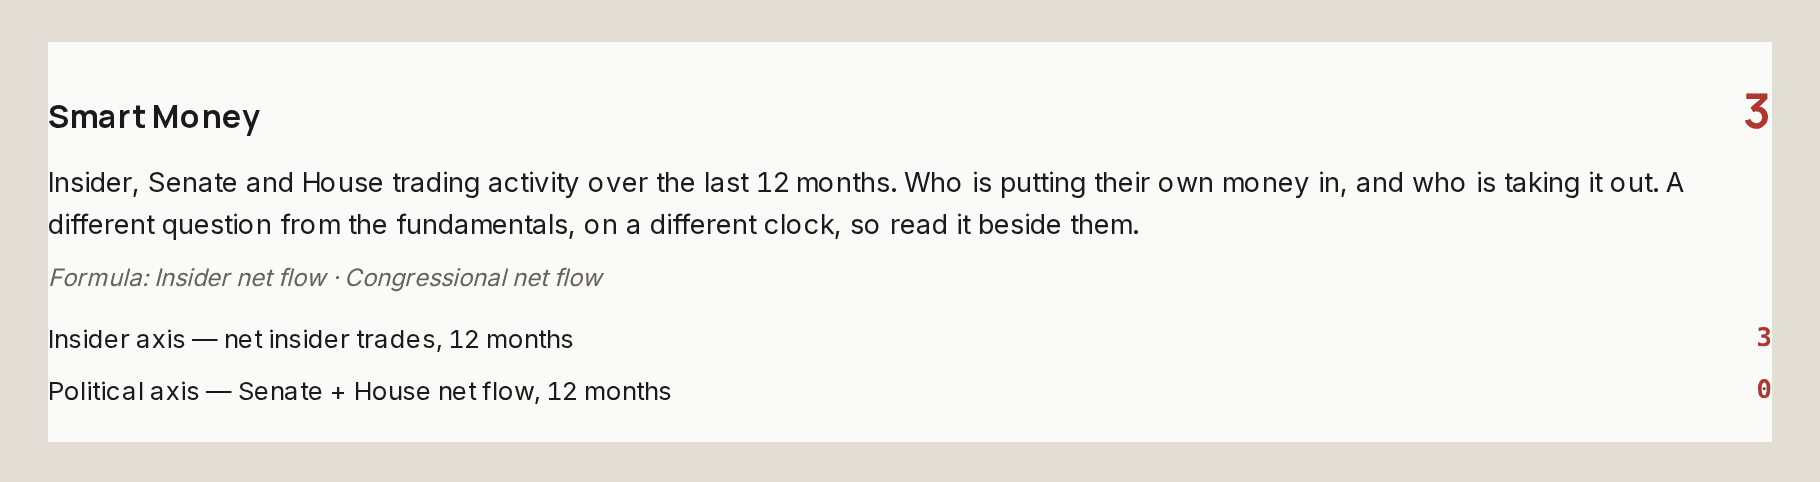
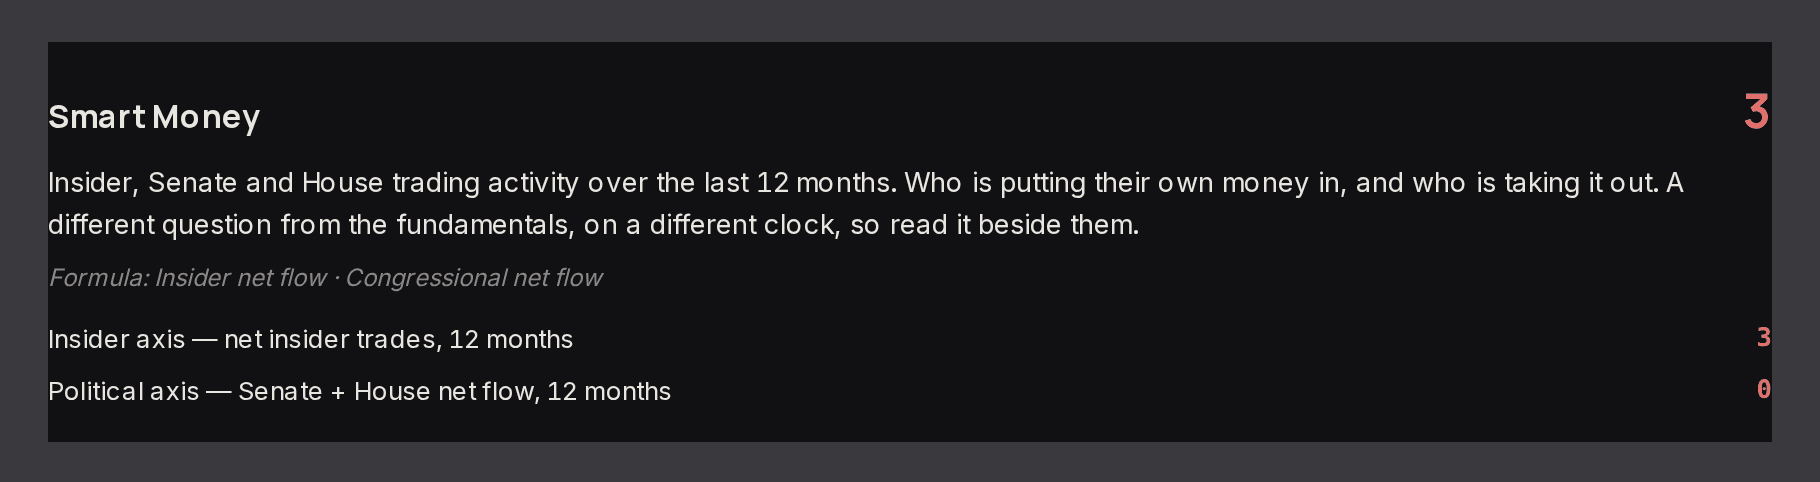
    Smart Money pillar, reading 3: insider axis 3, political axis 0, over the last 12 months.
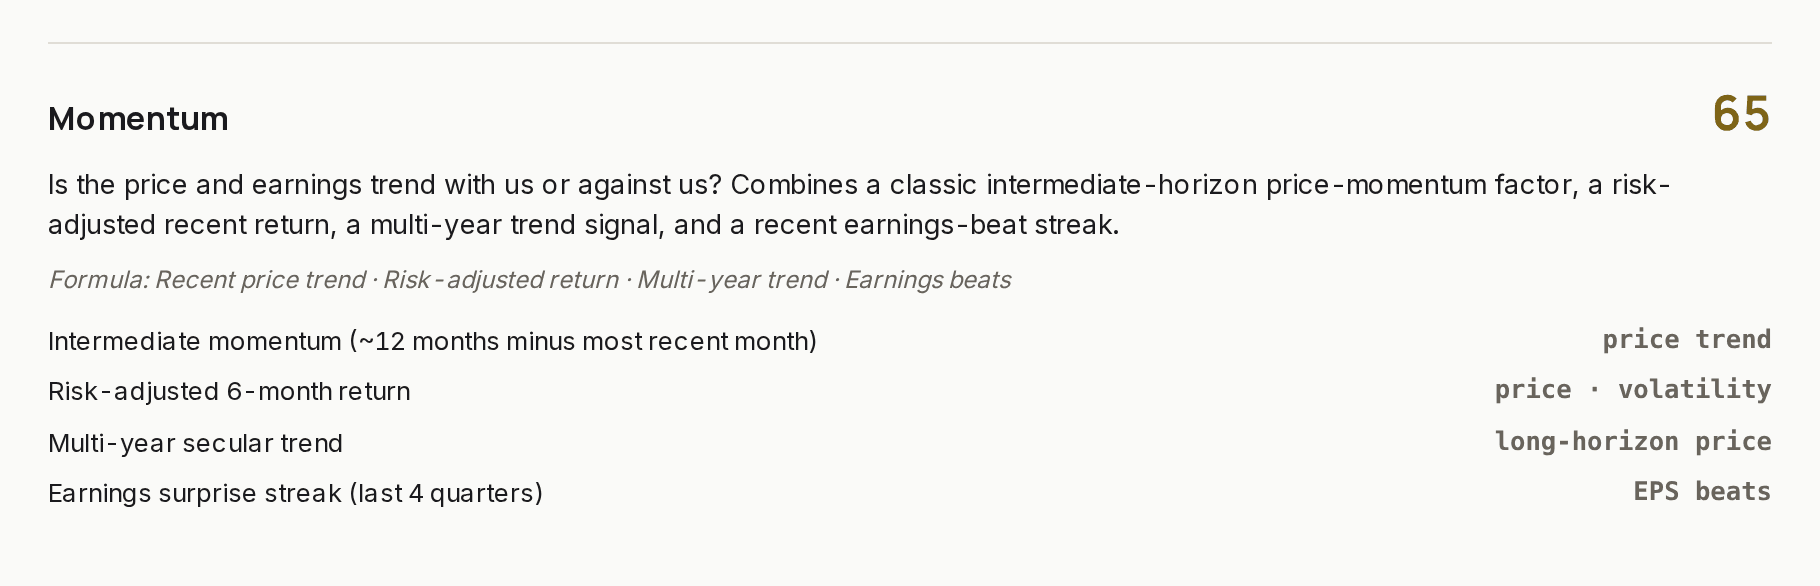
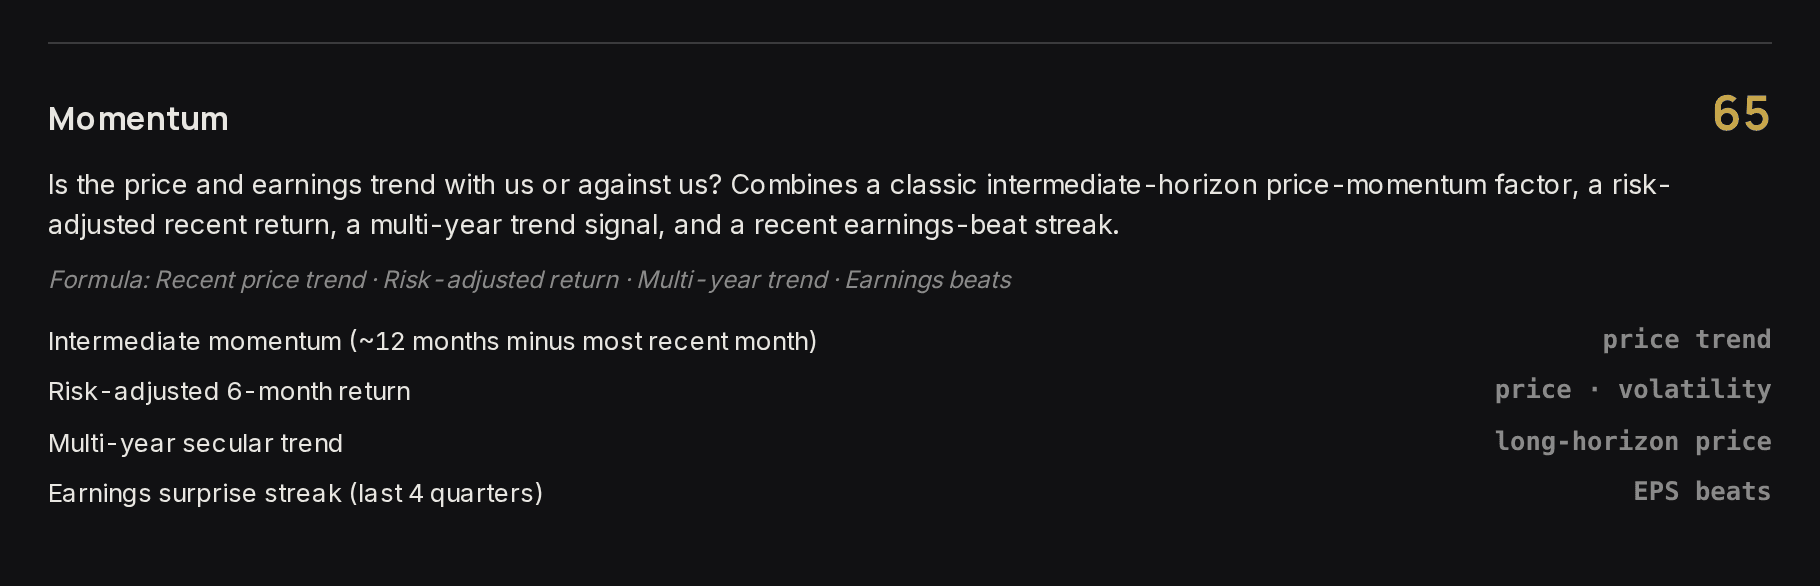
    Momentum pillar, reading 65: intermediate momentum, risk-adjusted six-month return, multi-year trend and the earnings-surprise streak.
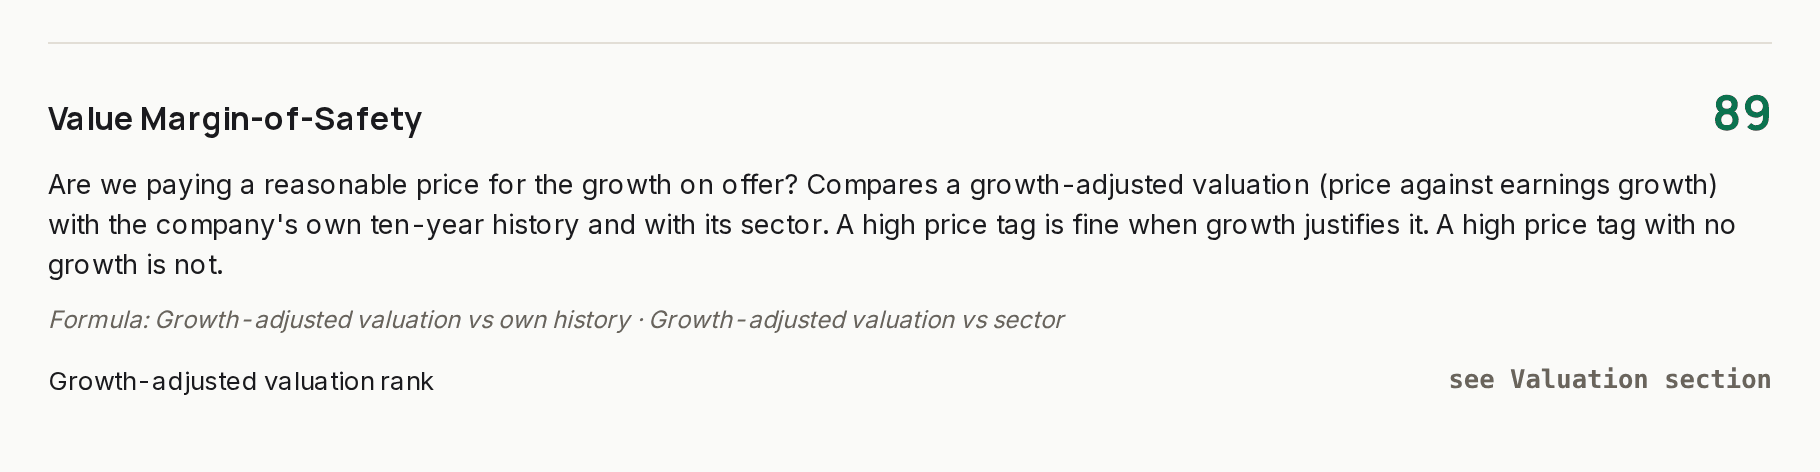
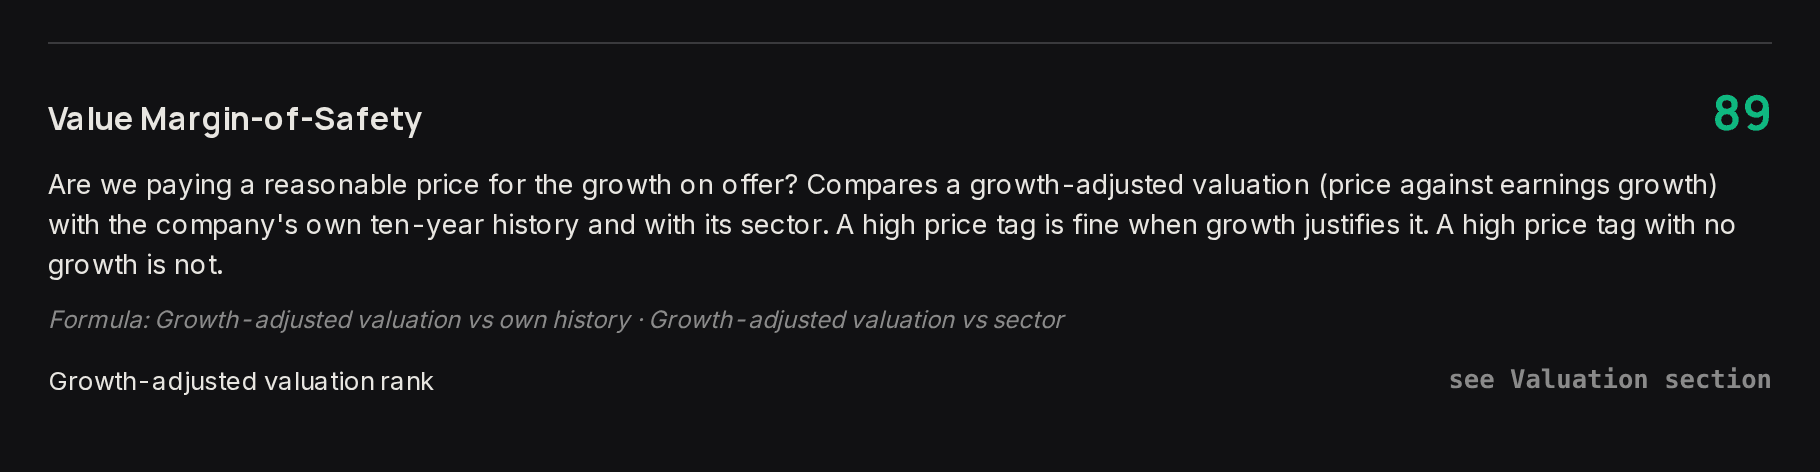
    Value Margin-of-Safety pillar, reading 89: growth-adjusted valuation against the company's own history and its sector, .
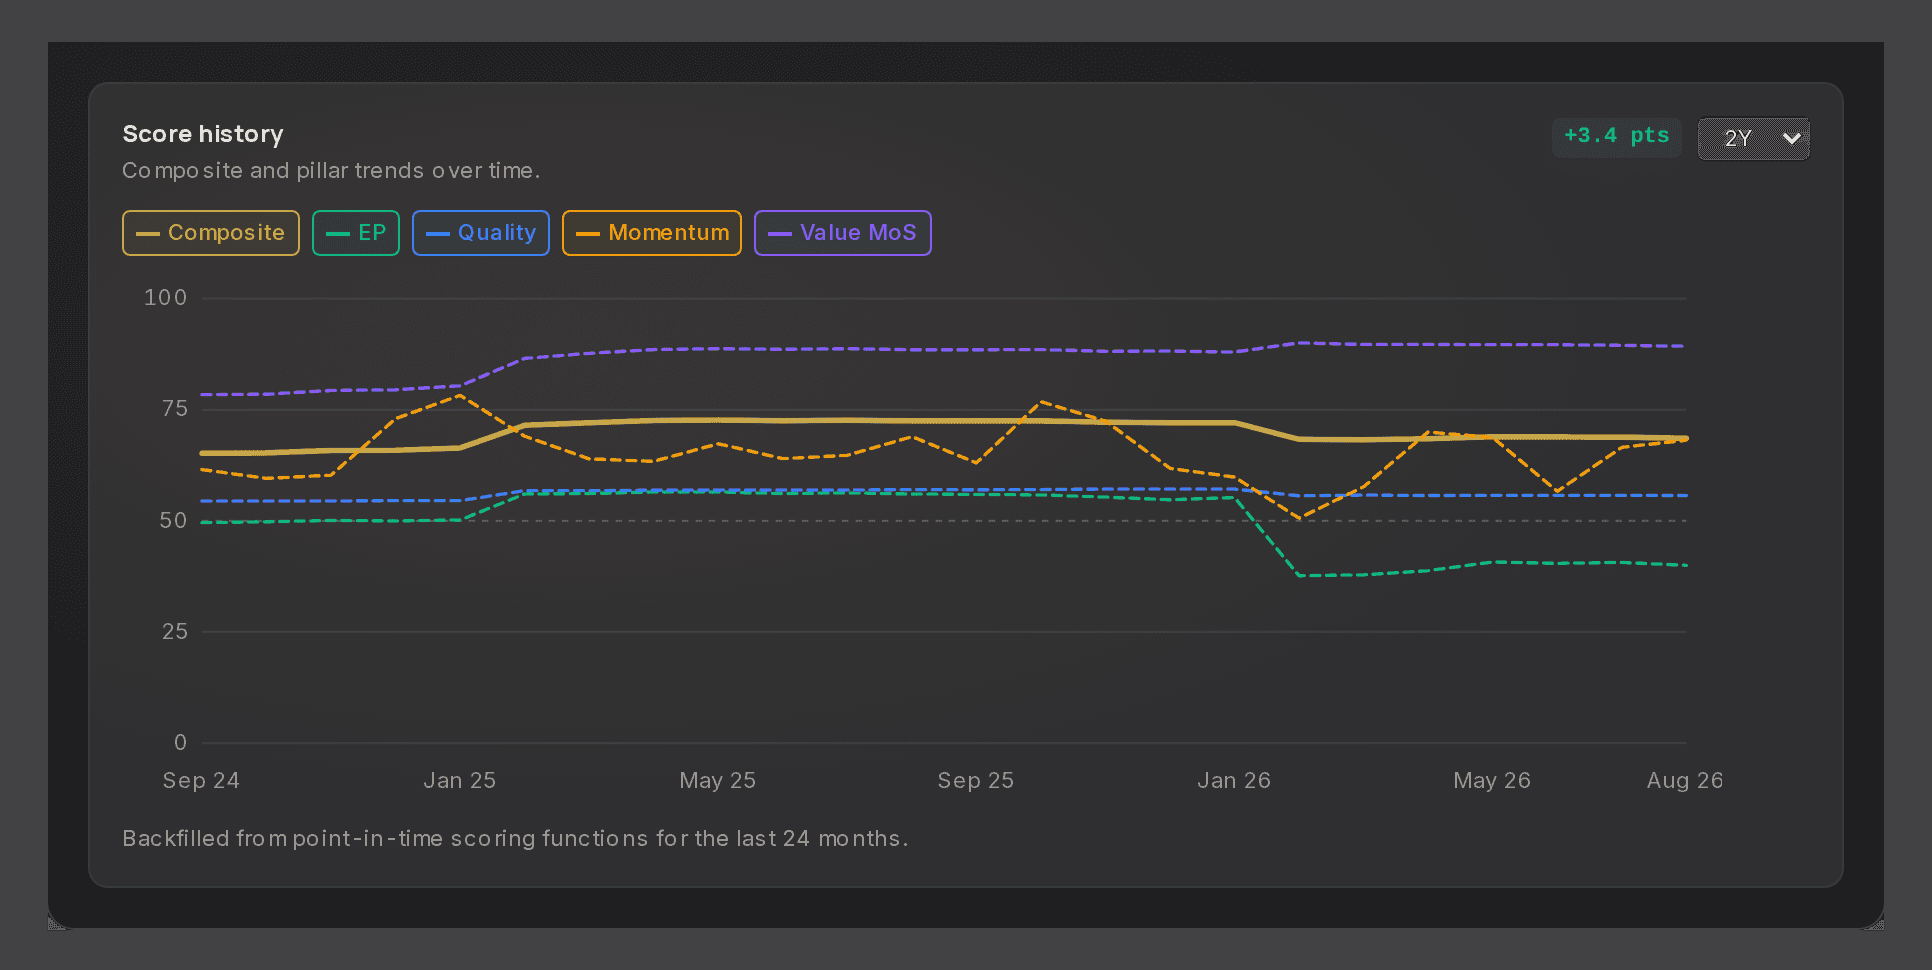
    Two years of score history for AMZN: the composite and each pillar as a line.

    How to read it. What you see is what the product shows: the sub-readings and what each one looks at. How they combine into the one number is ours and appears neither here nor in the PDF.

  6. Page 6Model, on filed inputs

    Fair value, shown working

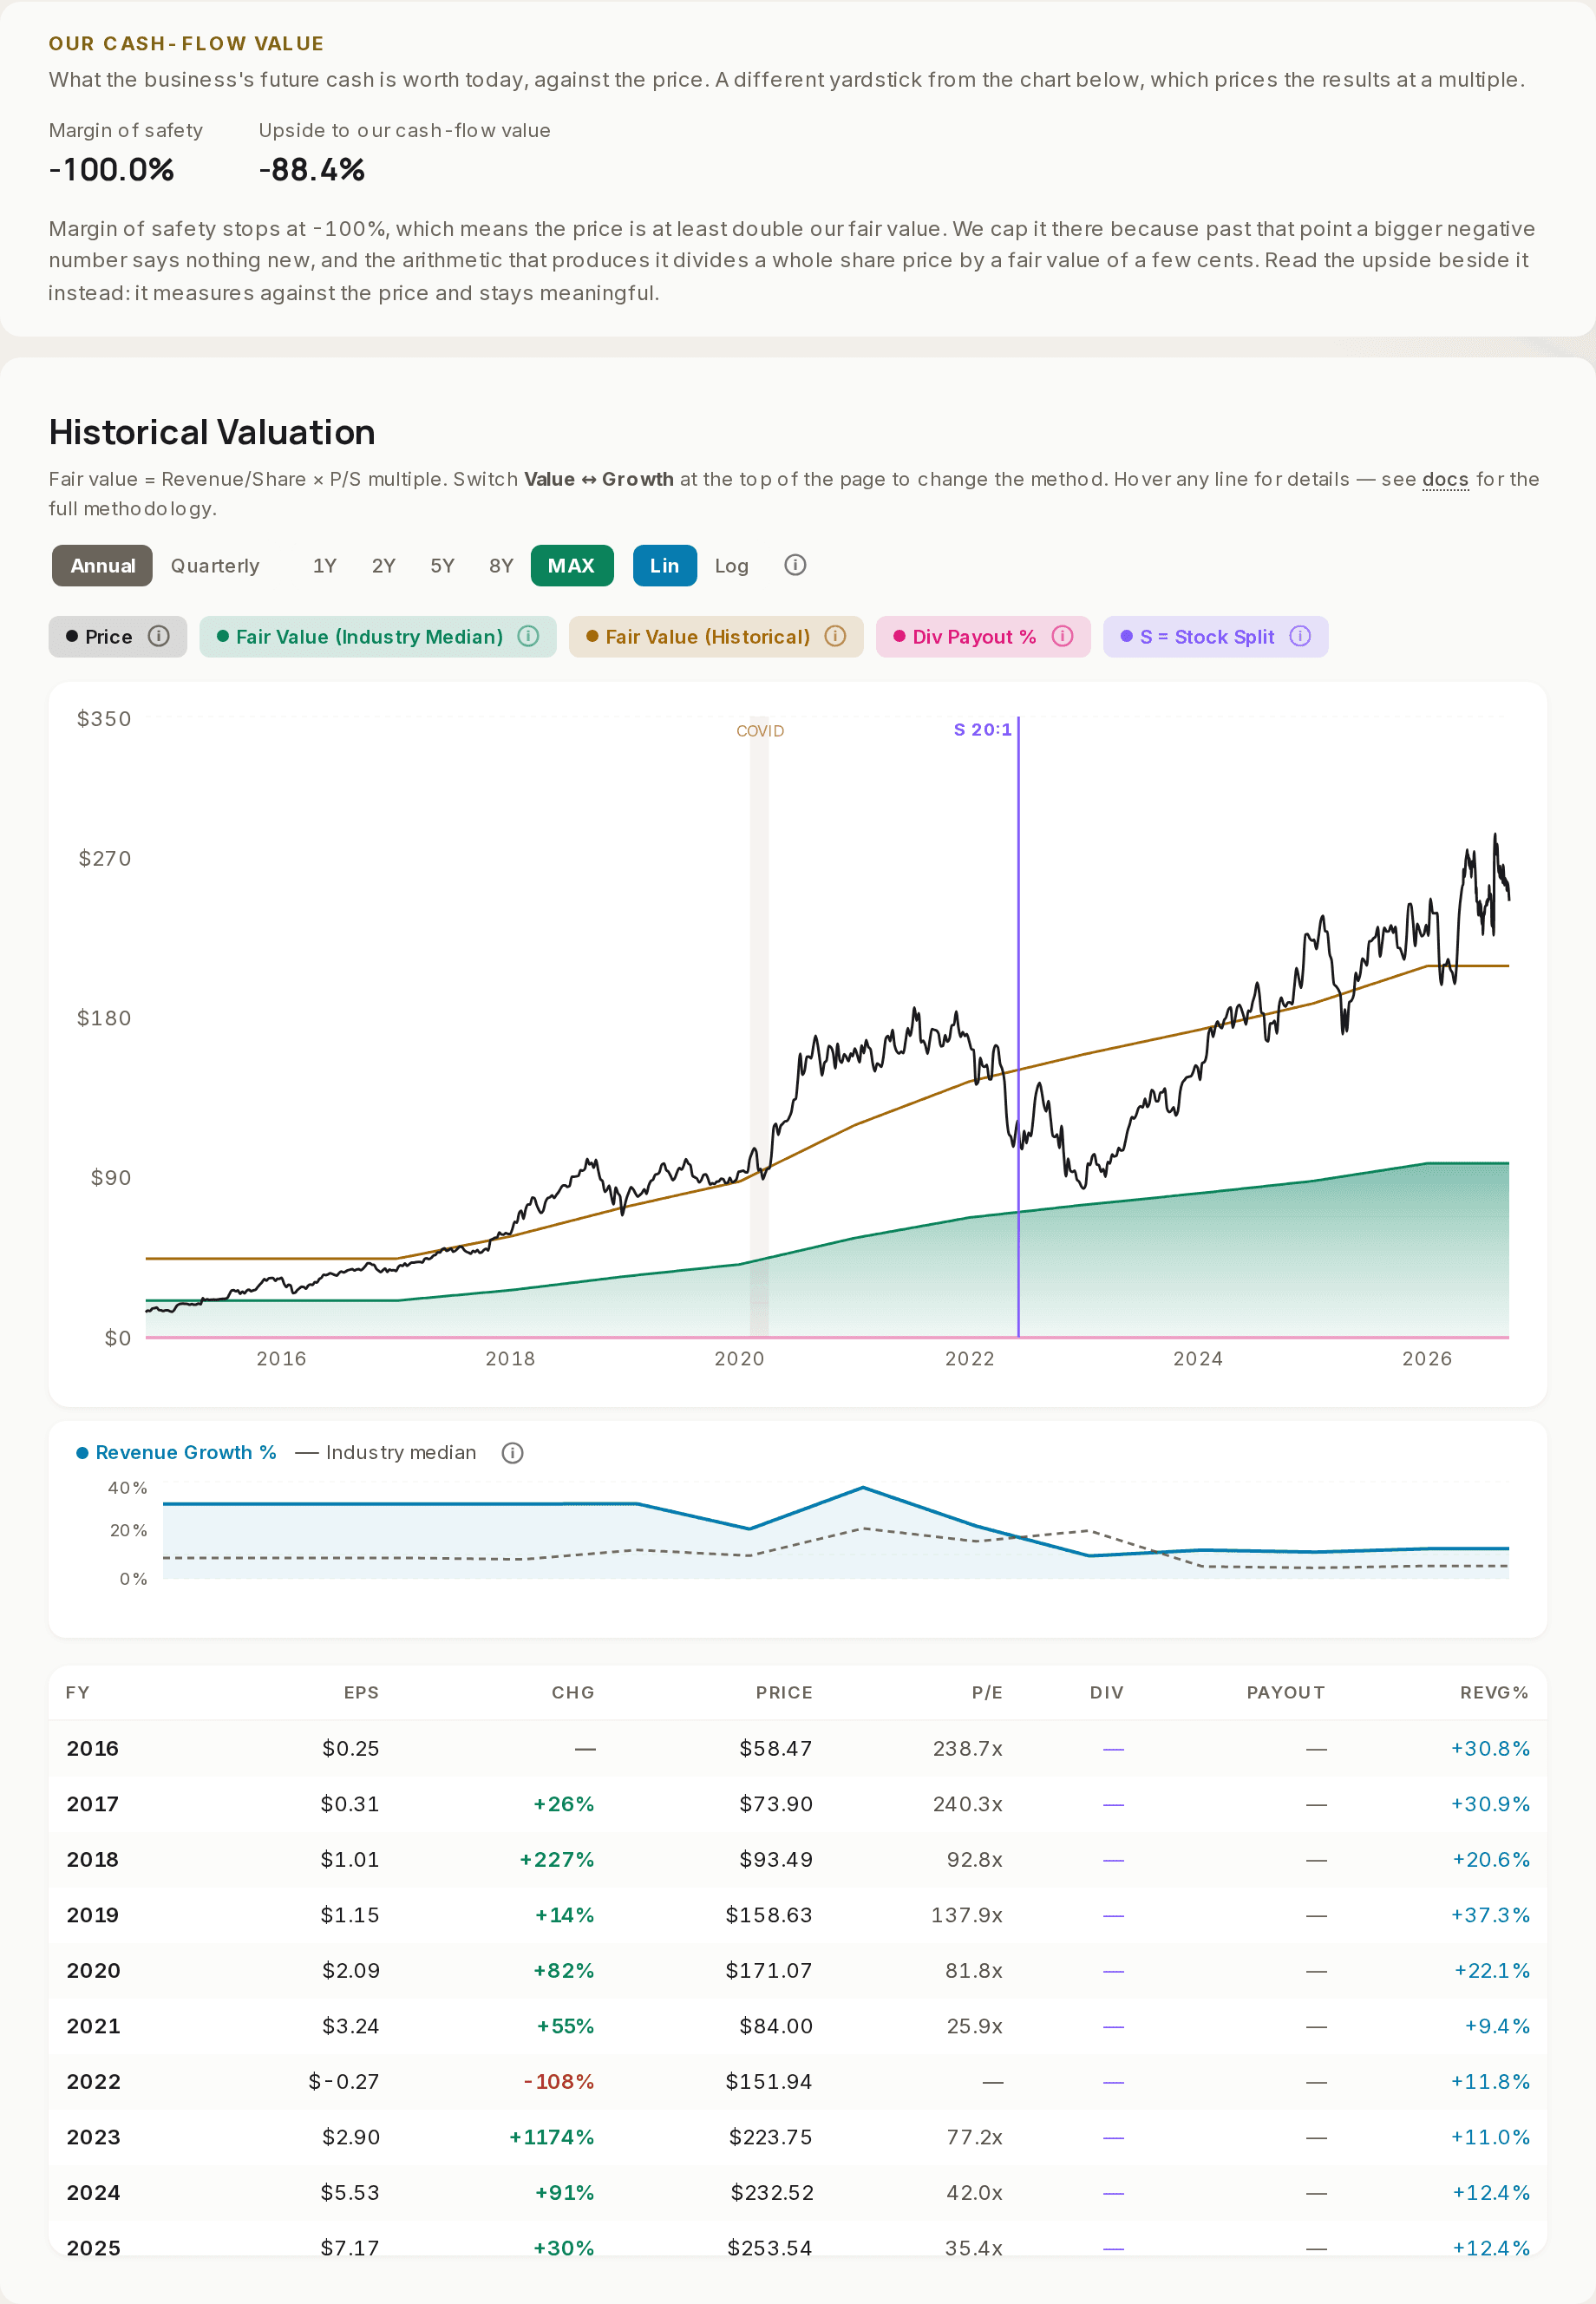
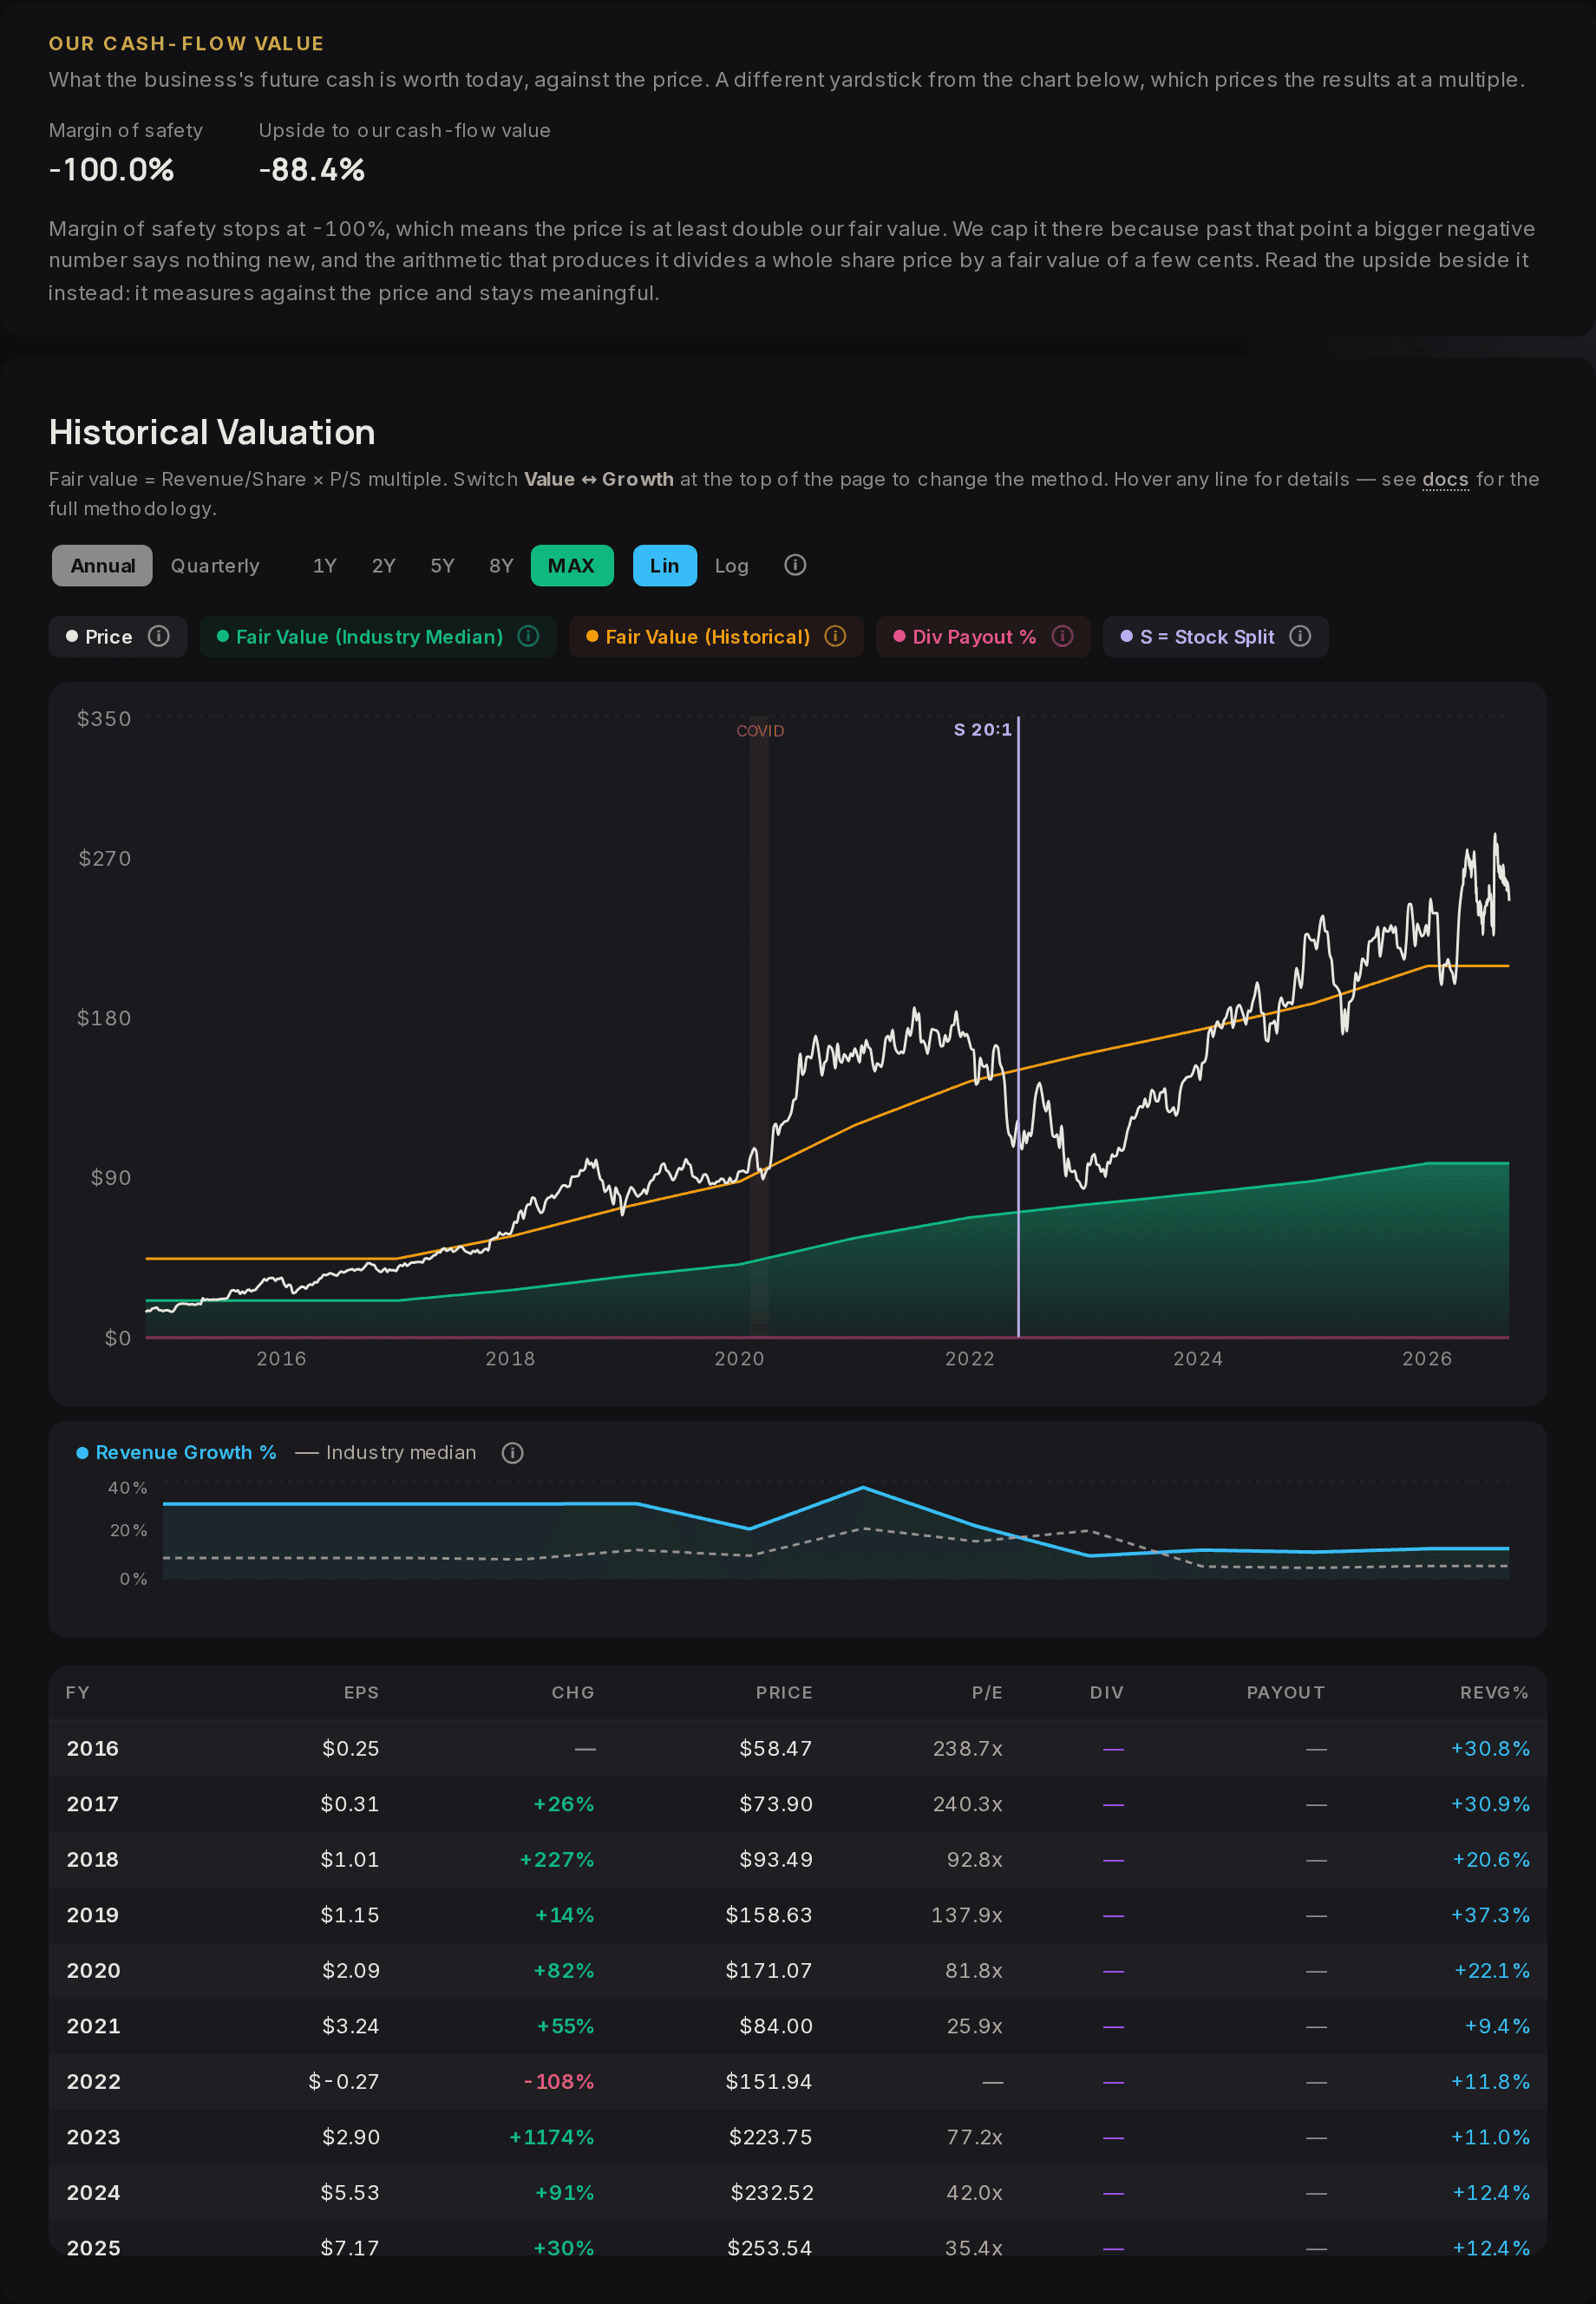
    The price against two yardsticks: what the industry's median company commands today, and what this company has commanded over its own history.

    Filed figures in the table, our arithmetic on the chart.

    Our cash-flow value strip (margin of safety -100.0%, upside -88.4%, with the note on the cap), then the historical valuation chart for AMZN since 2016: the price line, a green industry-median fair-value band and a gold historical fair-value line, with a table of filed EPS, year-end price and P/E per year.

    How to read it. Two yardsticks on one page. The strip at the top is our cash-flow value against the price, capped at -100% where the price is at least double it. The chart under it prices the filed results at a multiple: the table is filed EPS and year-end prices, the two lines are our arithmetic on them. Price above both lines is a premium to both yardsticks, below is a discount, and the gap is context, not a prediction.

  7. Page 7As filed

    Who runs it

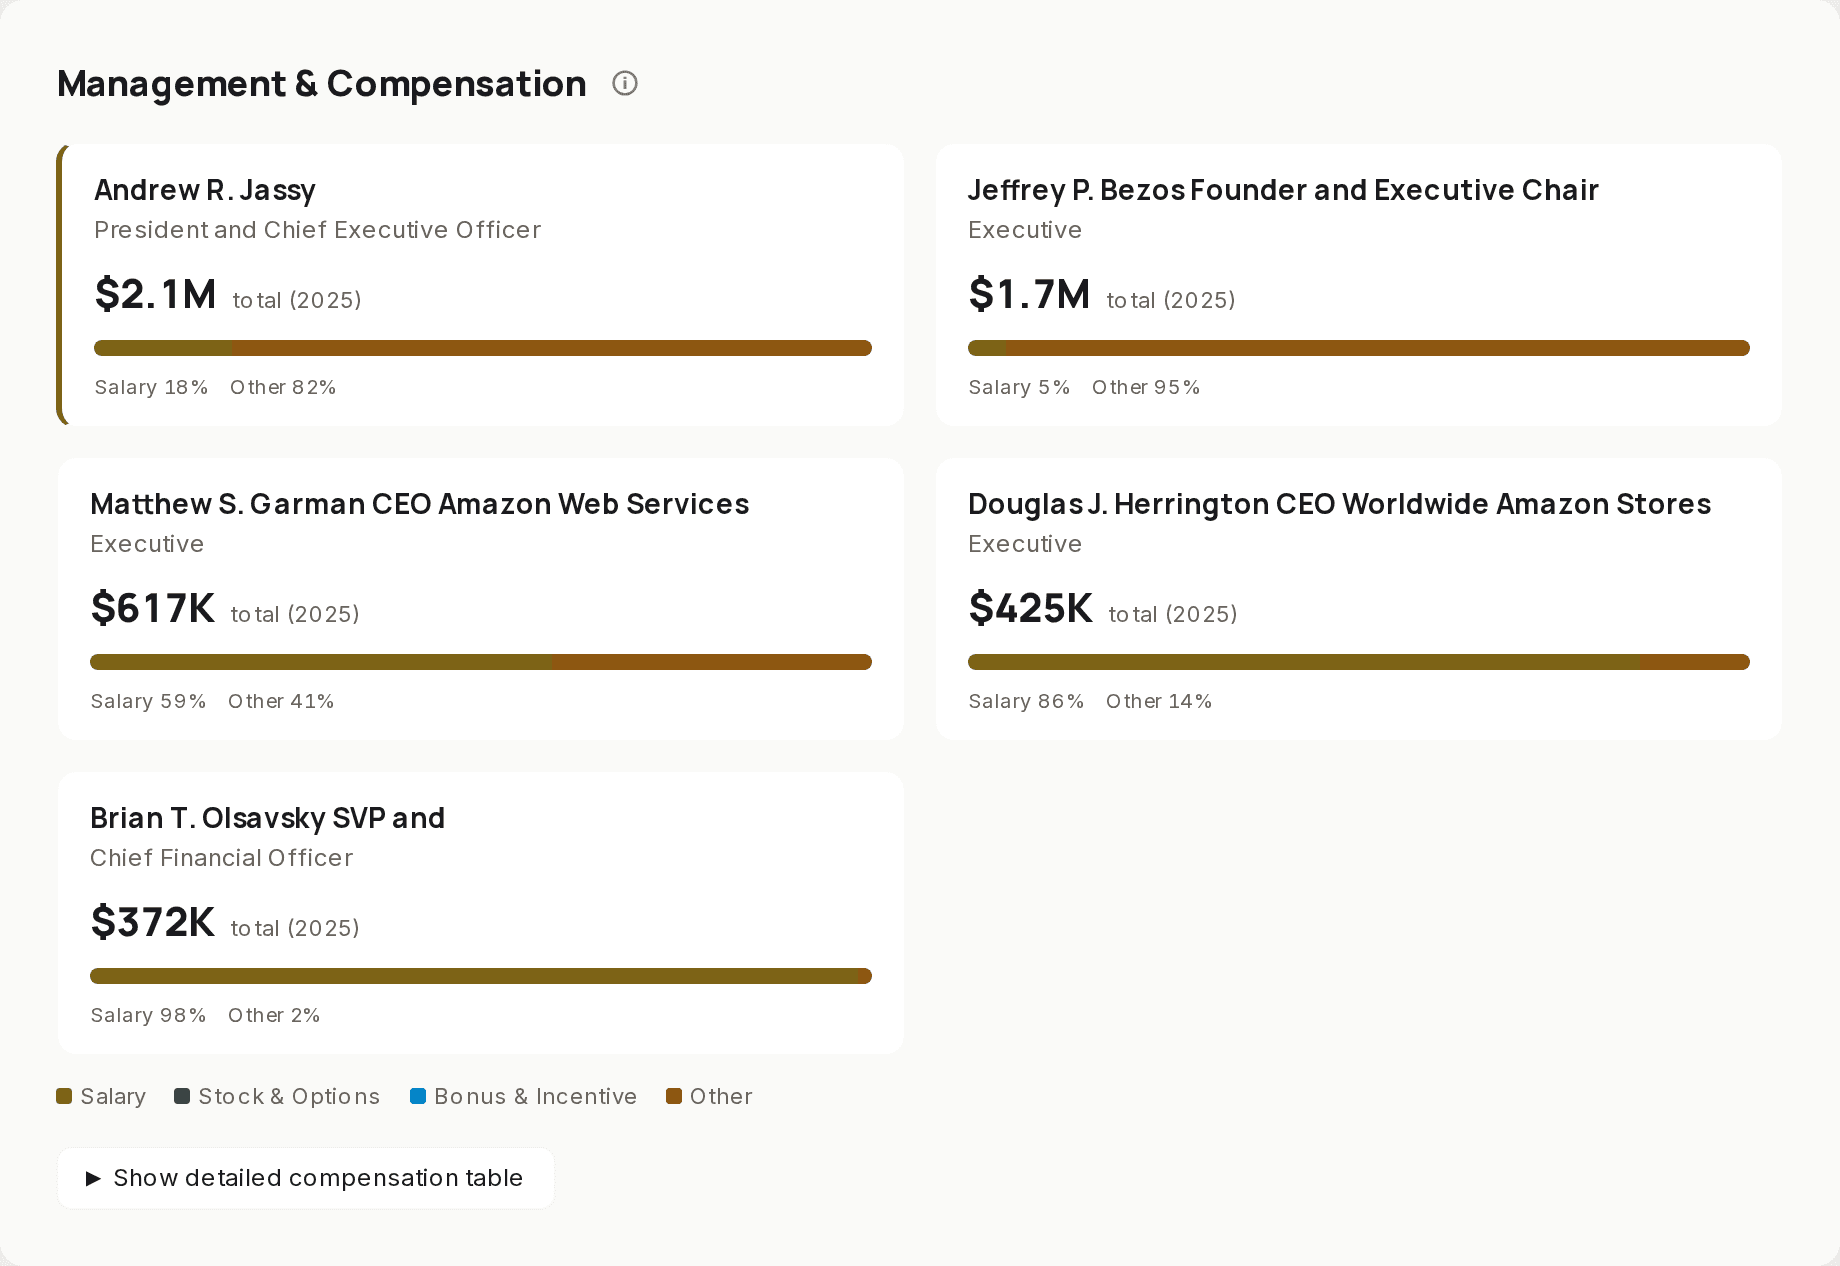
    The people in charge and what they were paid, from the proxy statement.

    Figures as the company filed them with the SEC. We do not adjust them.

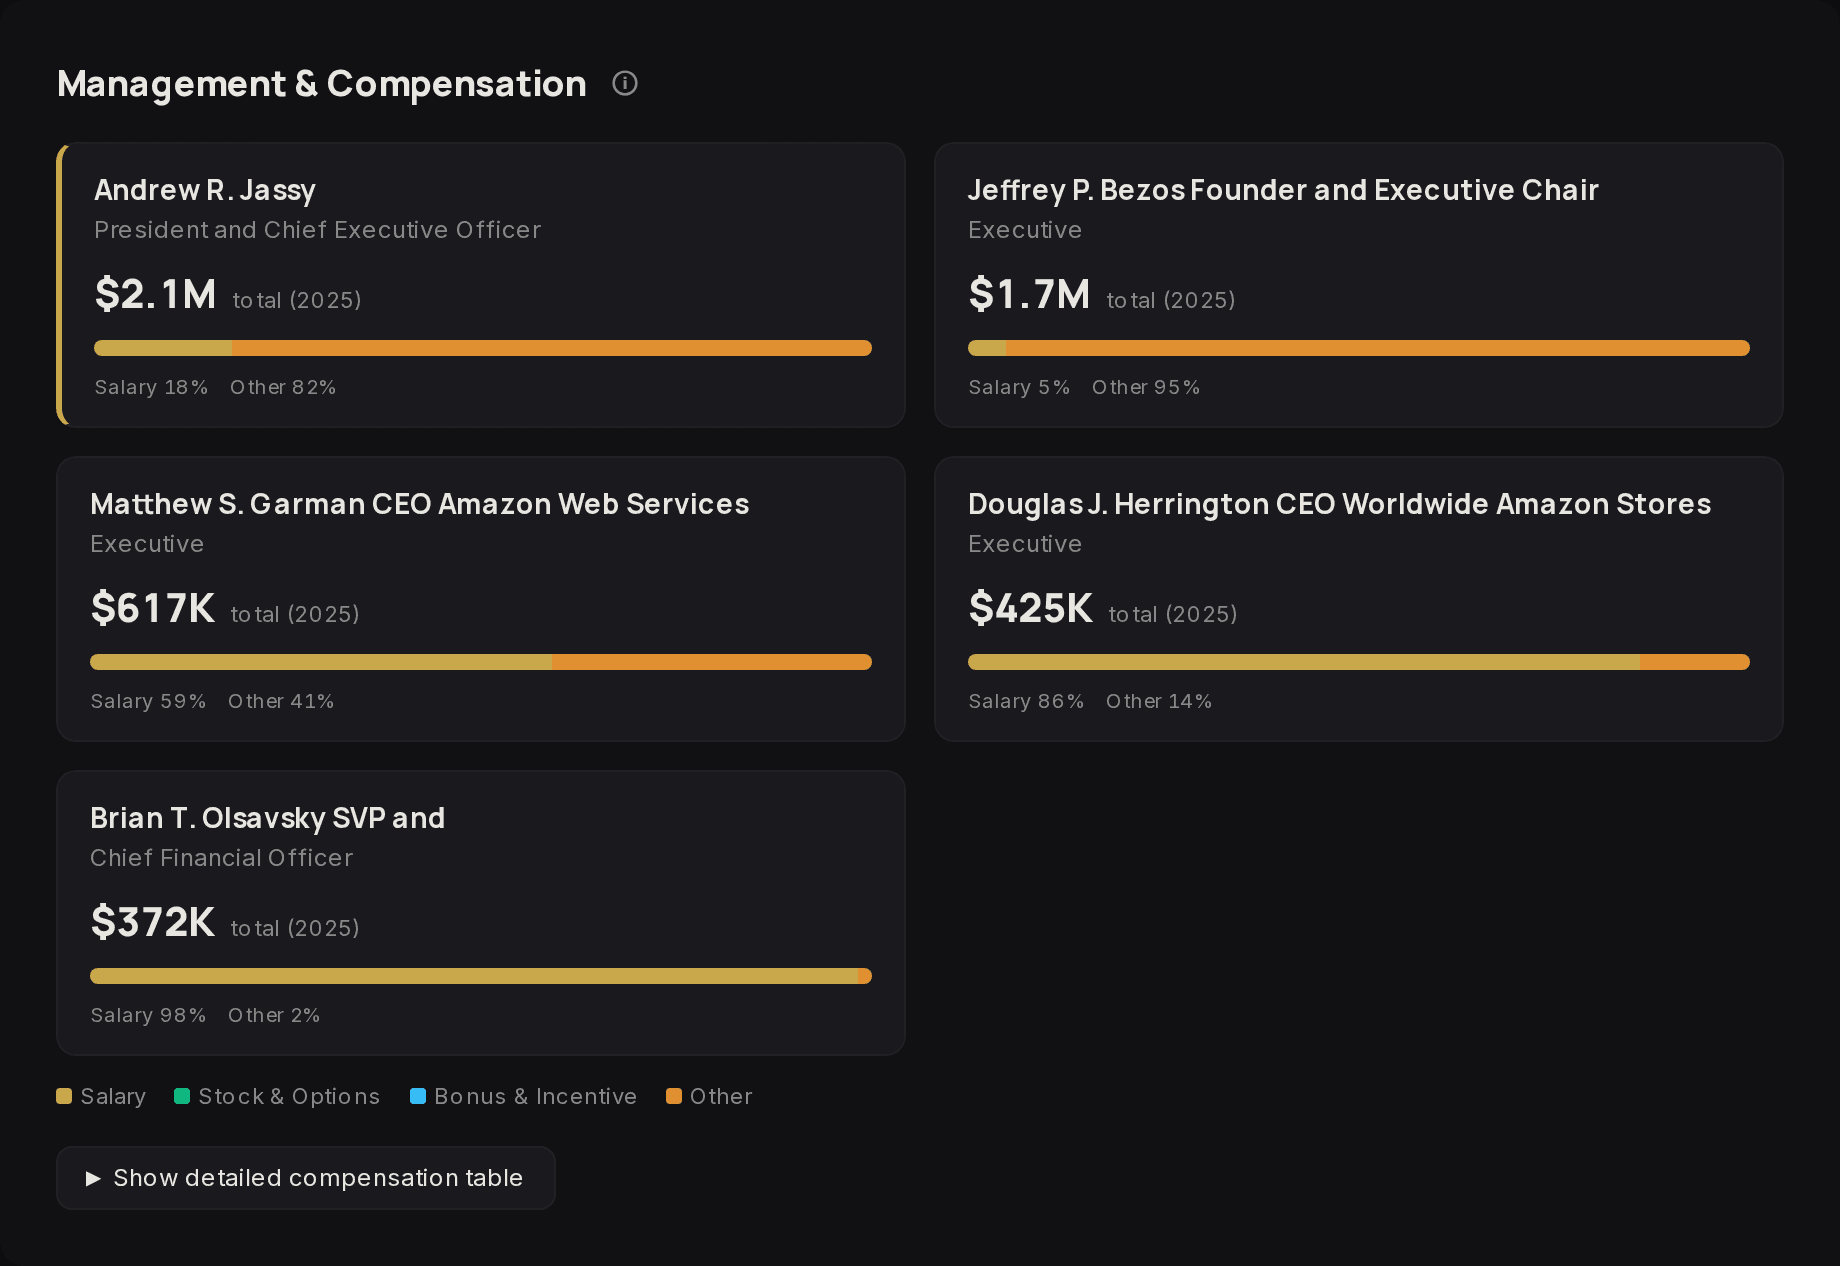
    Management and compensation for AMZN: five named officers with their 2025 total pay and its split between salary and other components.
  8. Page 8As filed

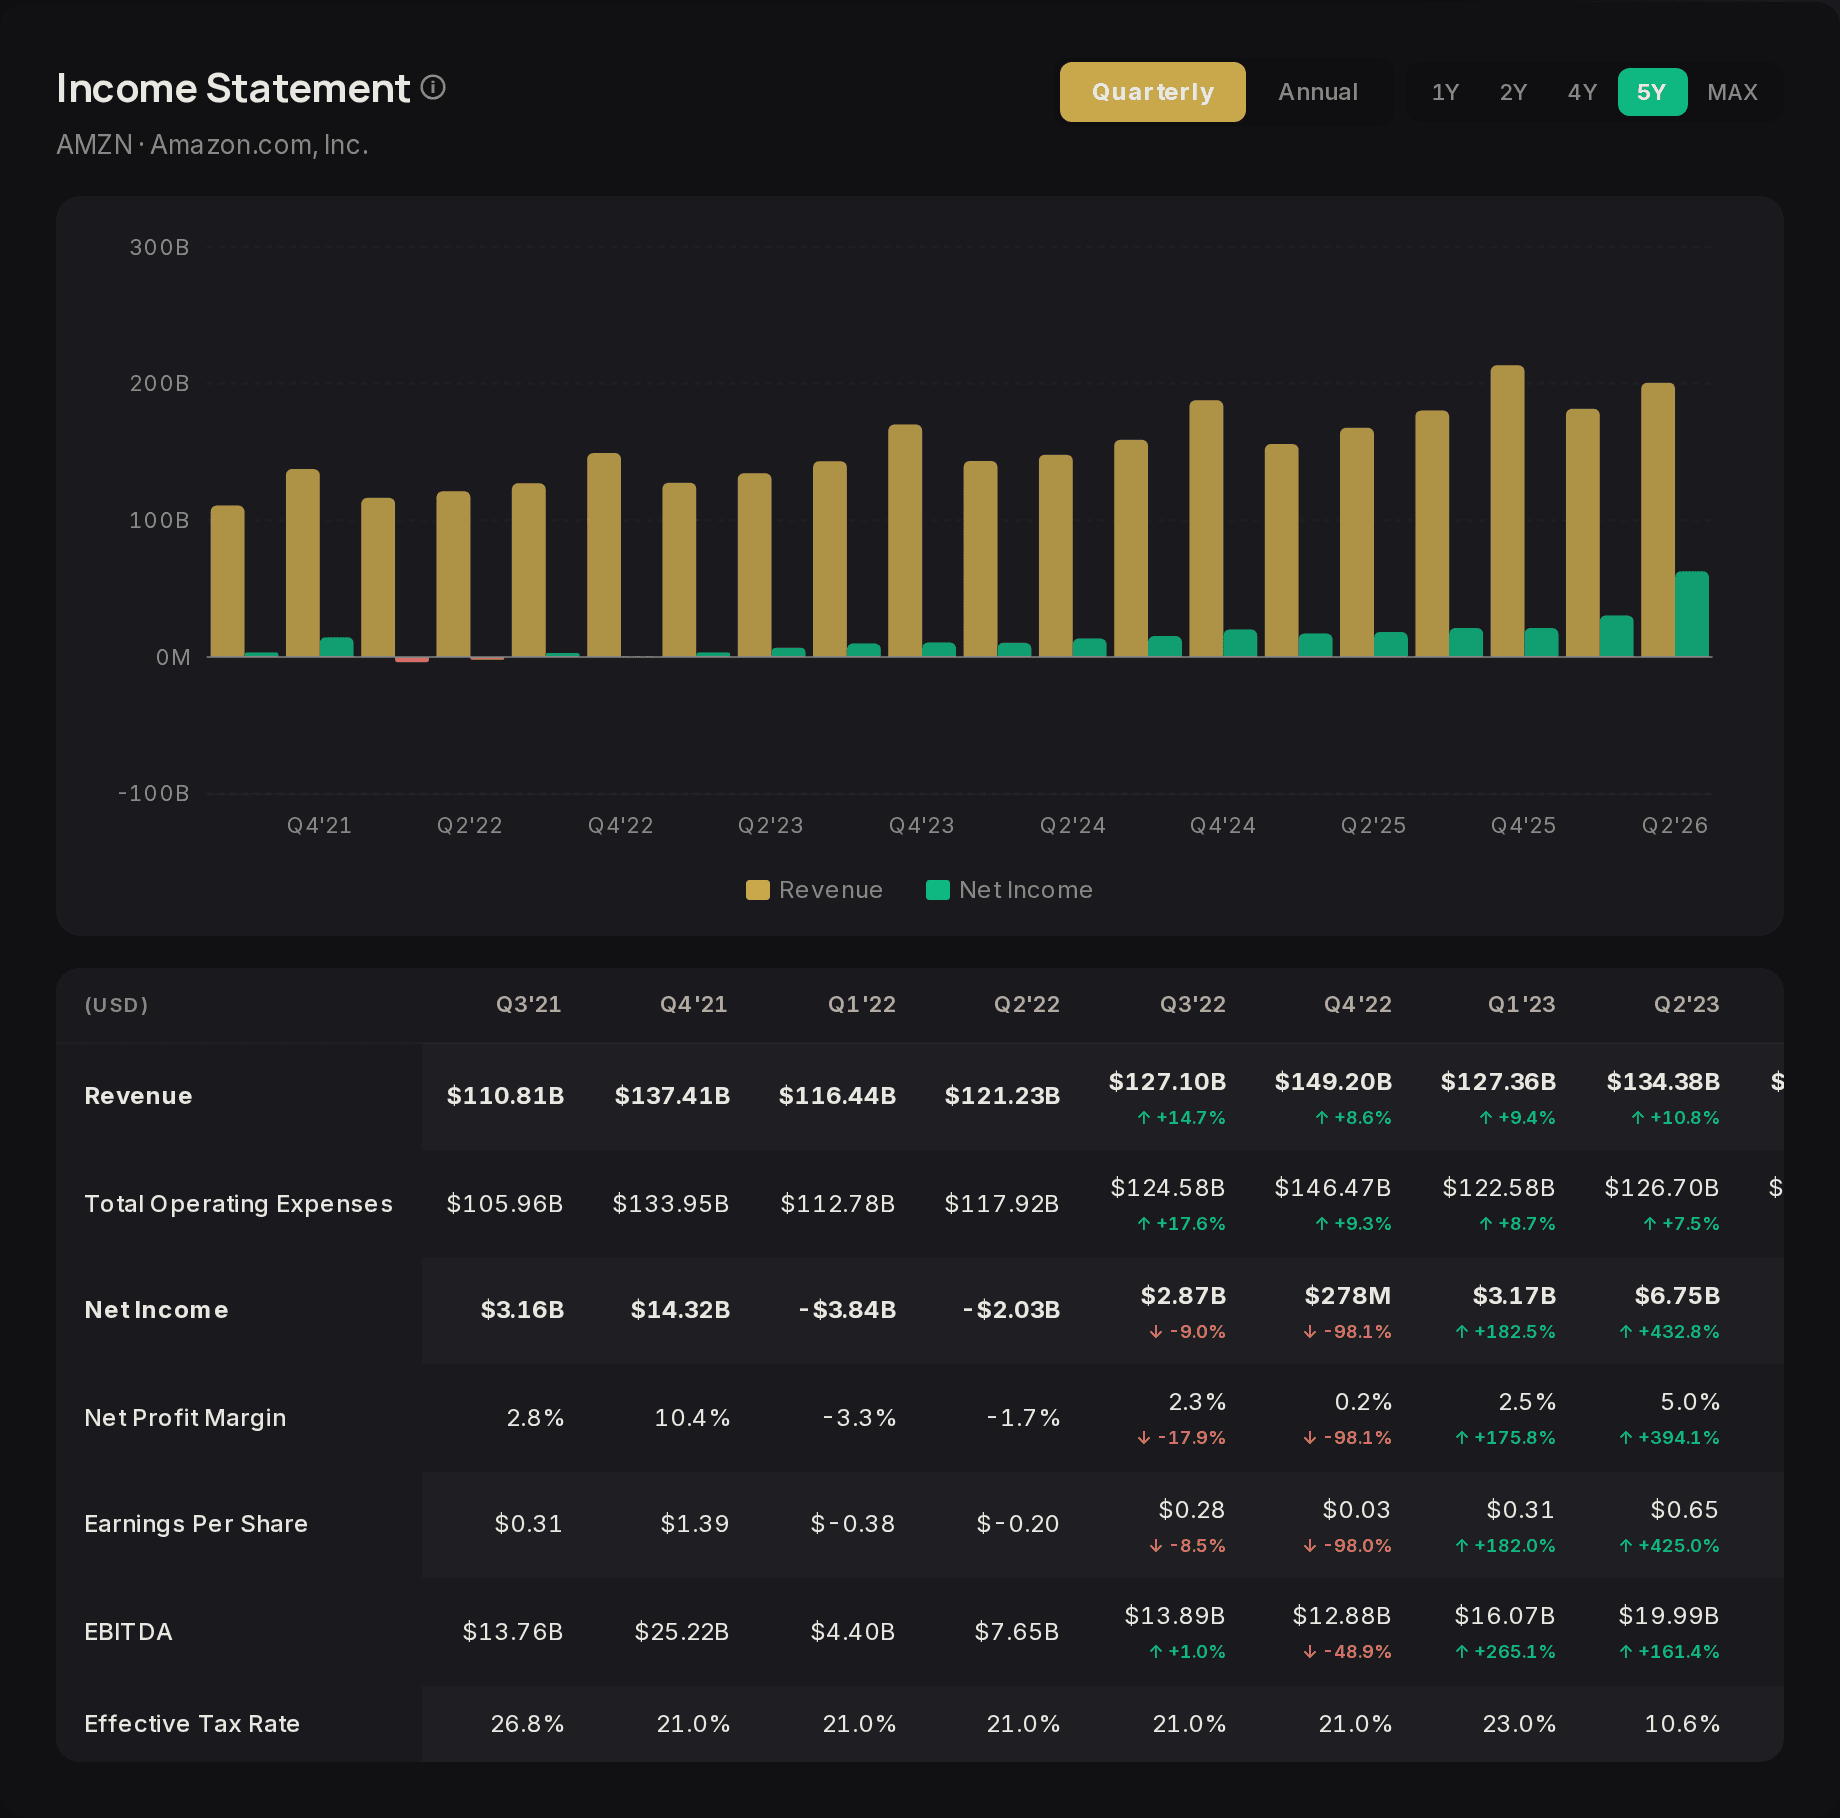
    Income statement

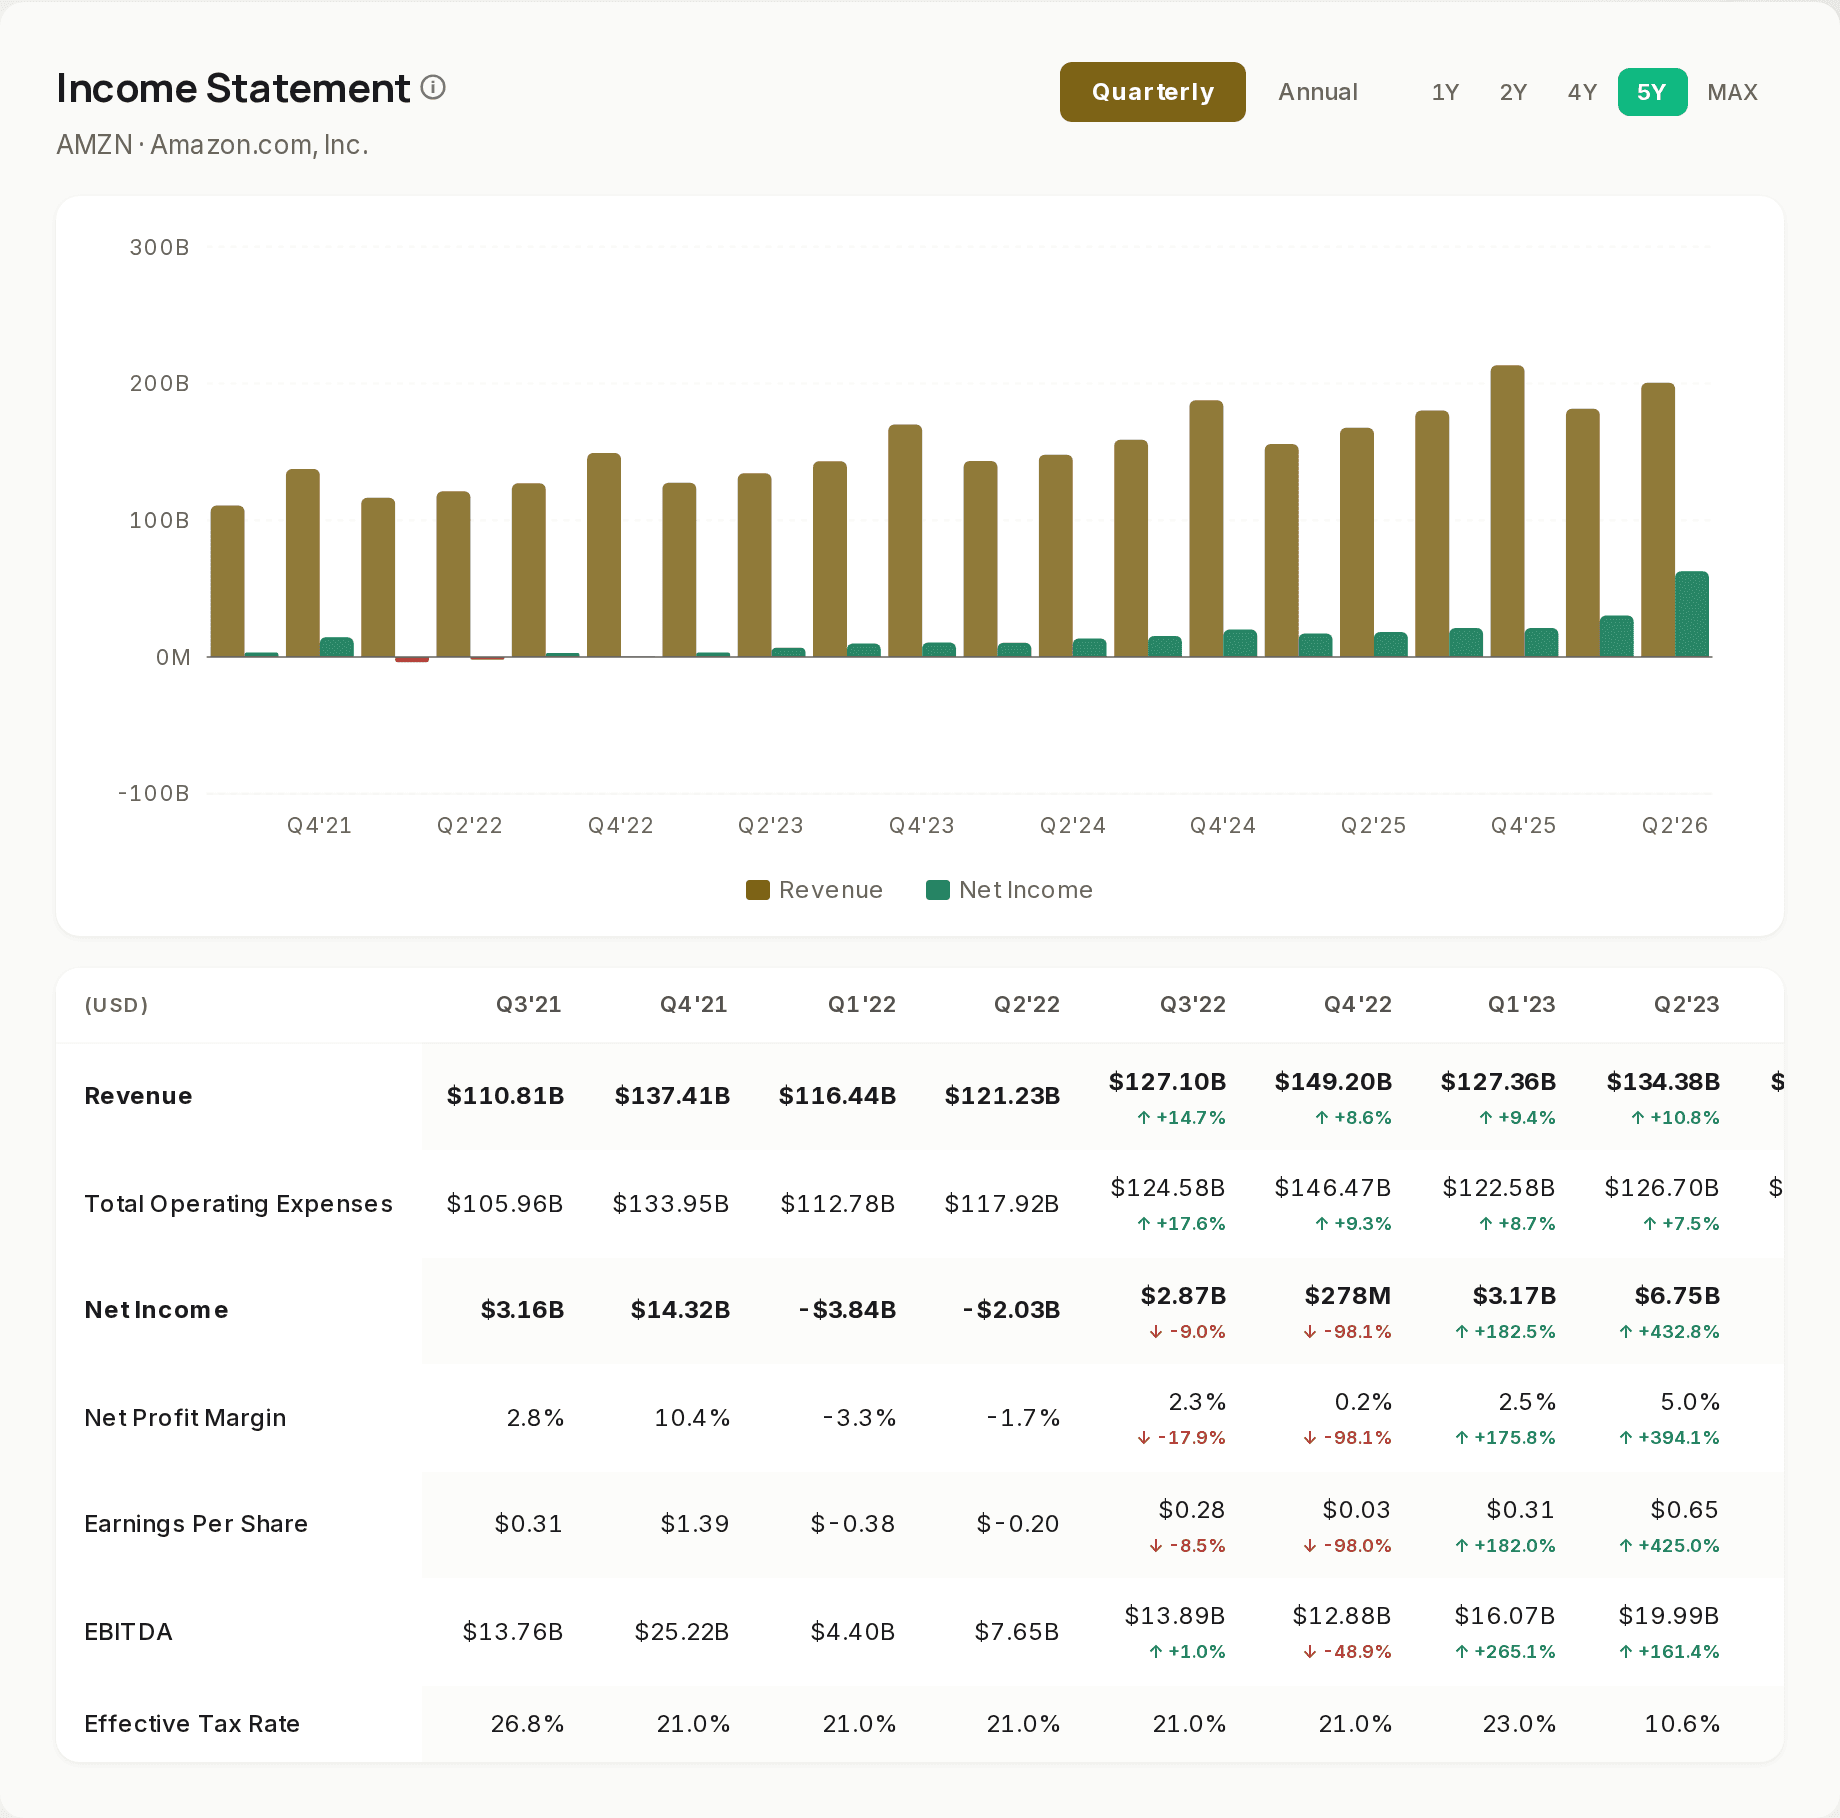
    Revenue down to profit, quarter by quarter, as filed.

    Figures as the company filed them with the SEC. We do not adjust them.

    Five years of quarterly revenue and net income for AMZN as bars, with a table of revenue, total operating expenses, net income, margin, EPS, EBITDA and tax rate per quarter.

    How to read it. The newest quarter on the chart is Q2 2026, the quarter to 30 June 2026. The table scrolls sideways in the product; the capture shows its first columns.

  9. Page 9Arithmetic on filings

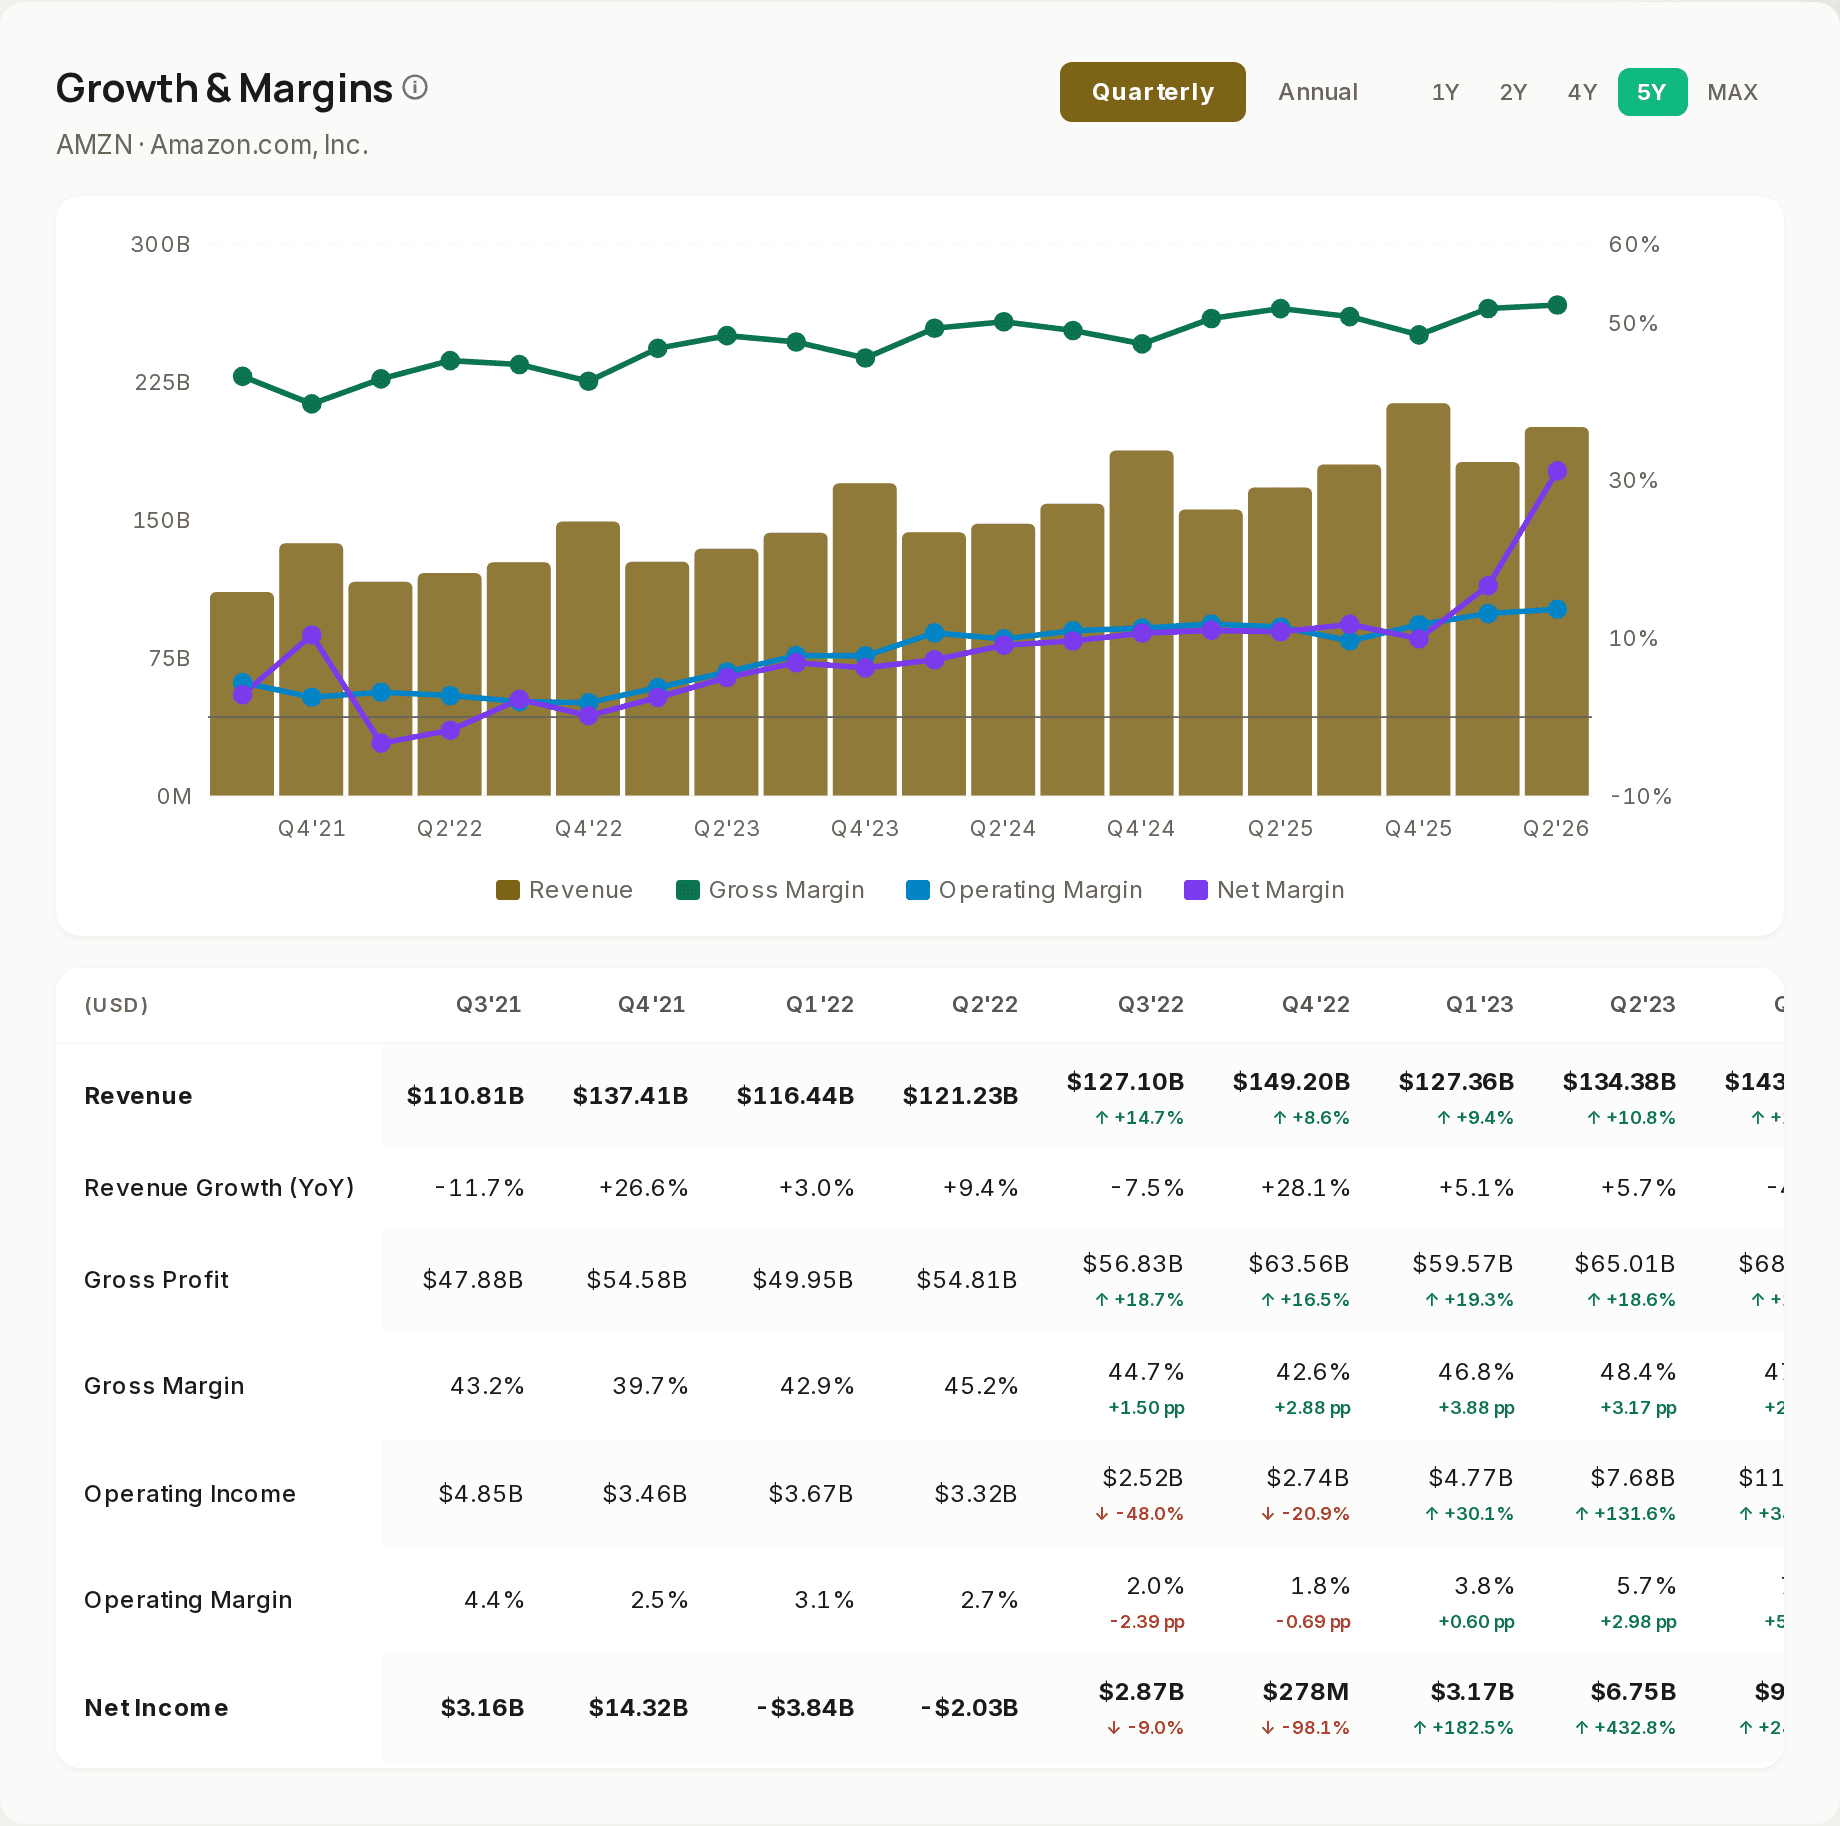
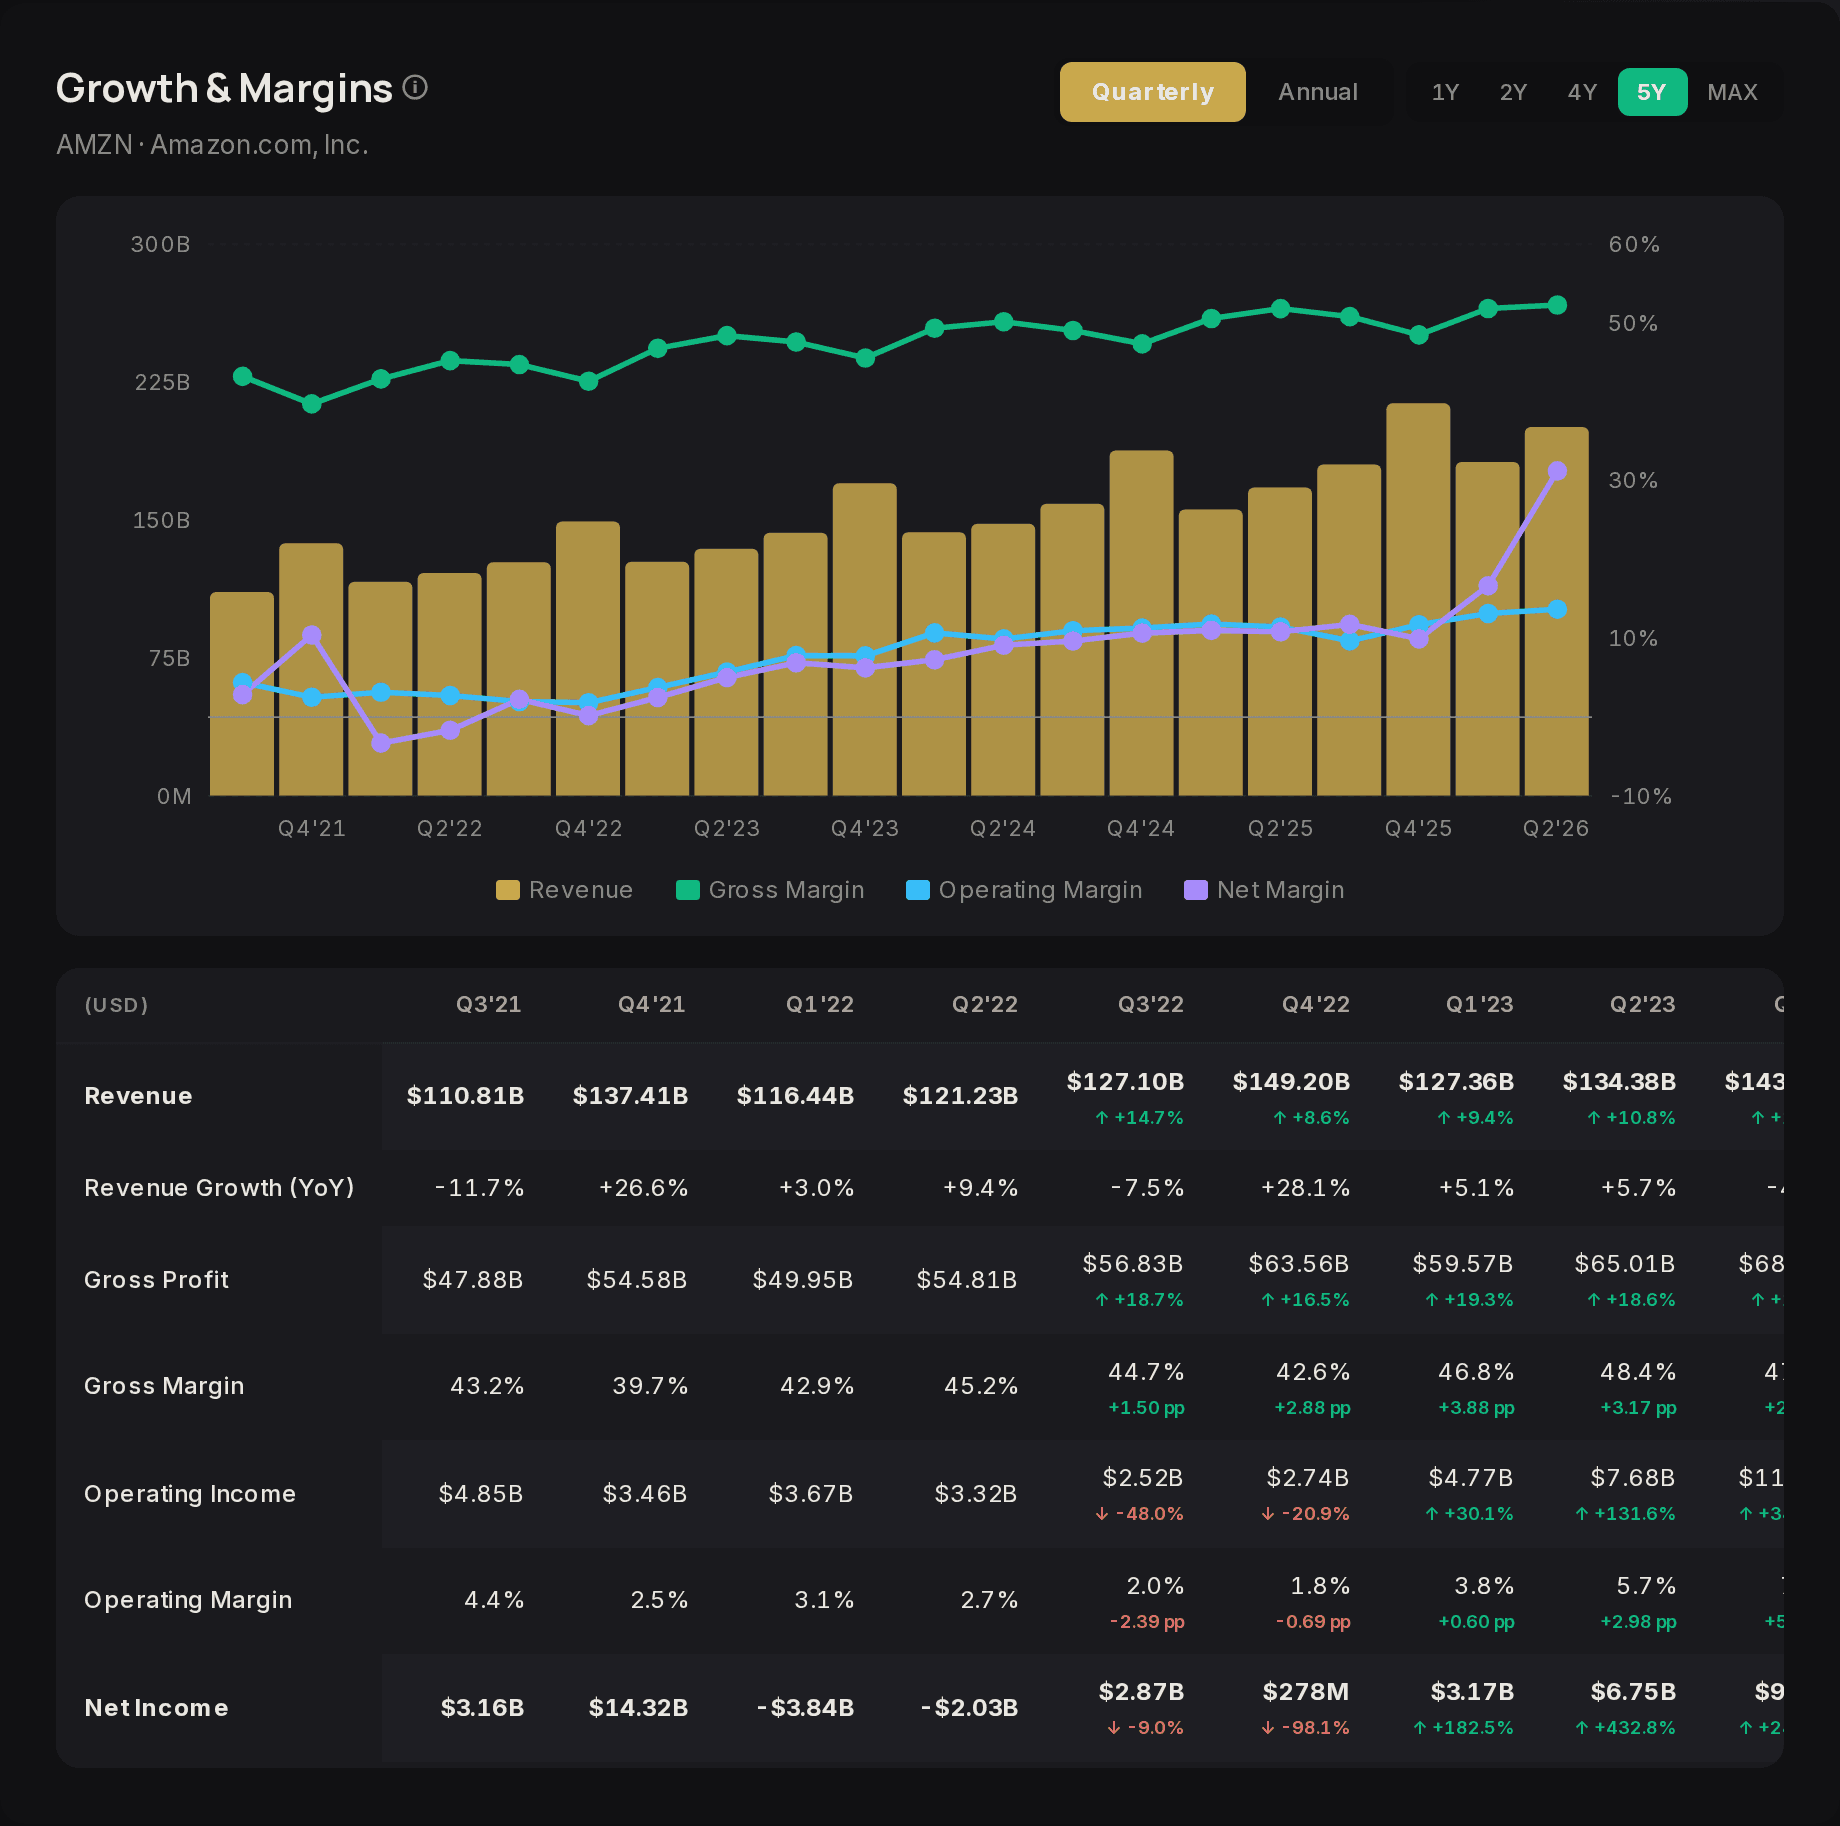
    Growth and margins

    How fast the business grows and what it keeps of every dollar.

    Growth rates and margins we compute from the filed figures. No model in it.

    Growth and margin charts for AMZN over five years.
  10. Page 10As filed

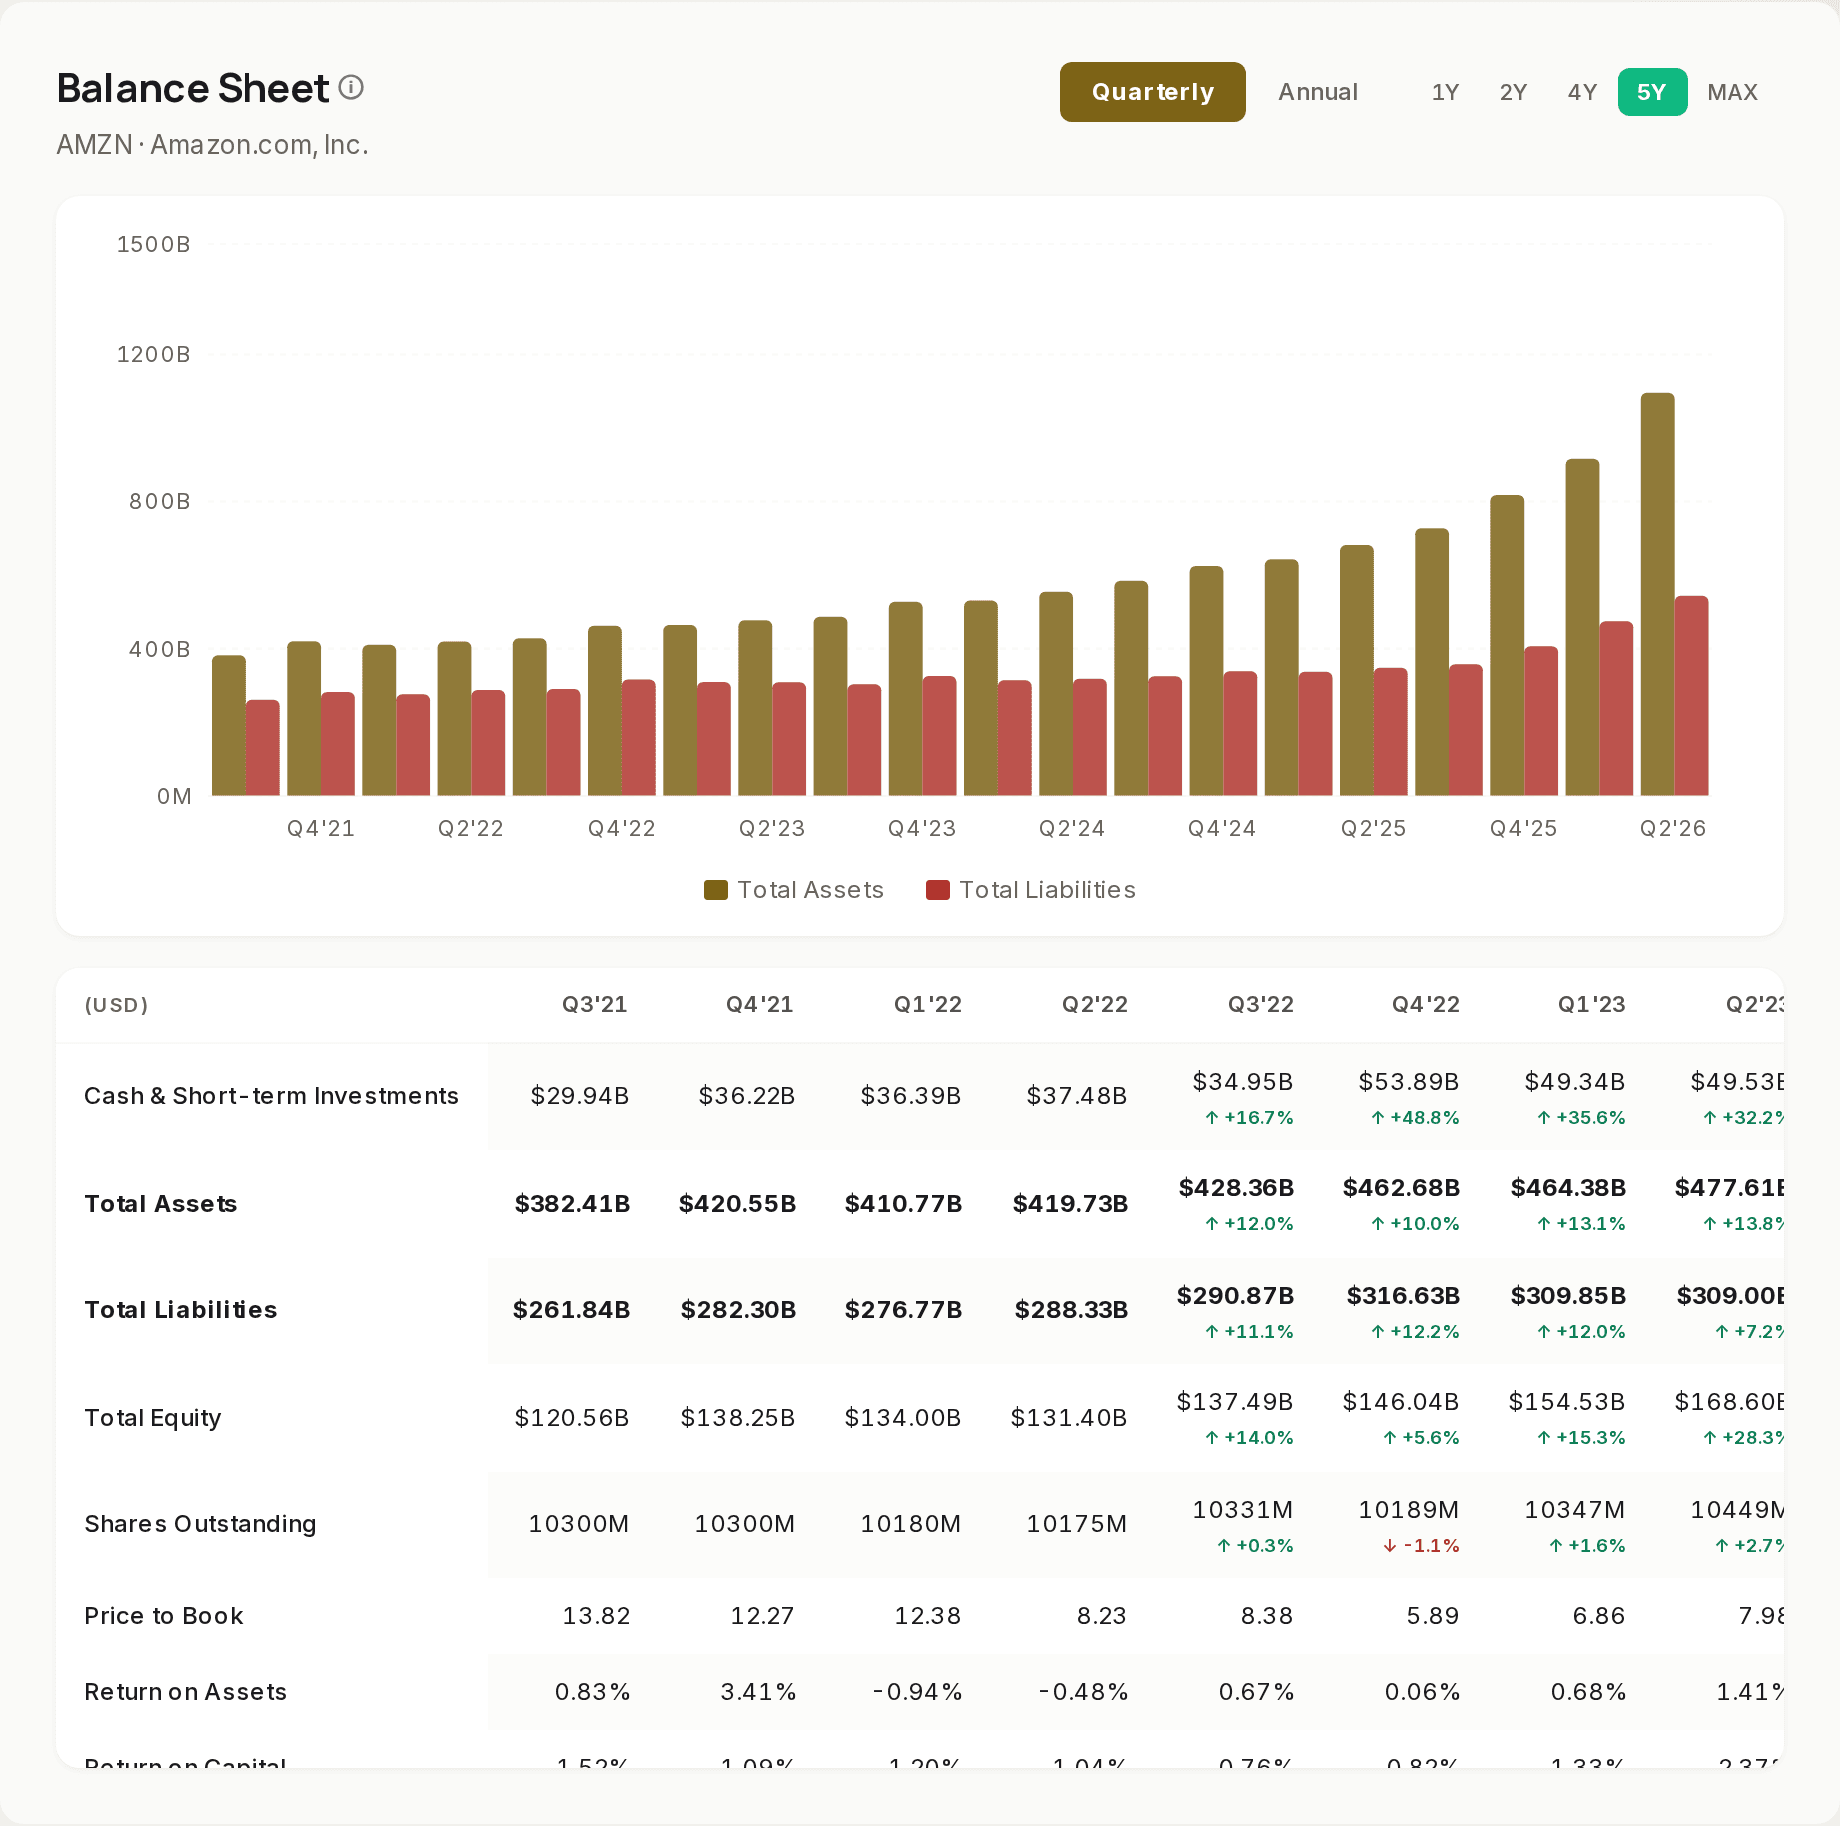
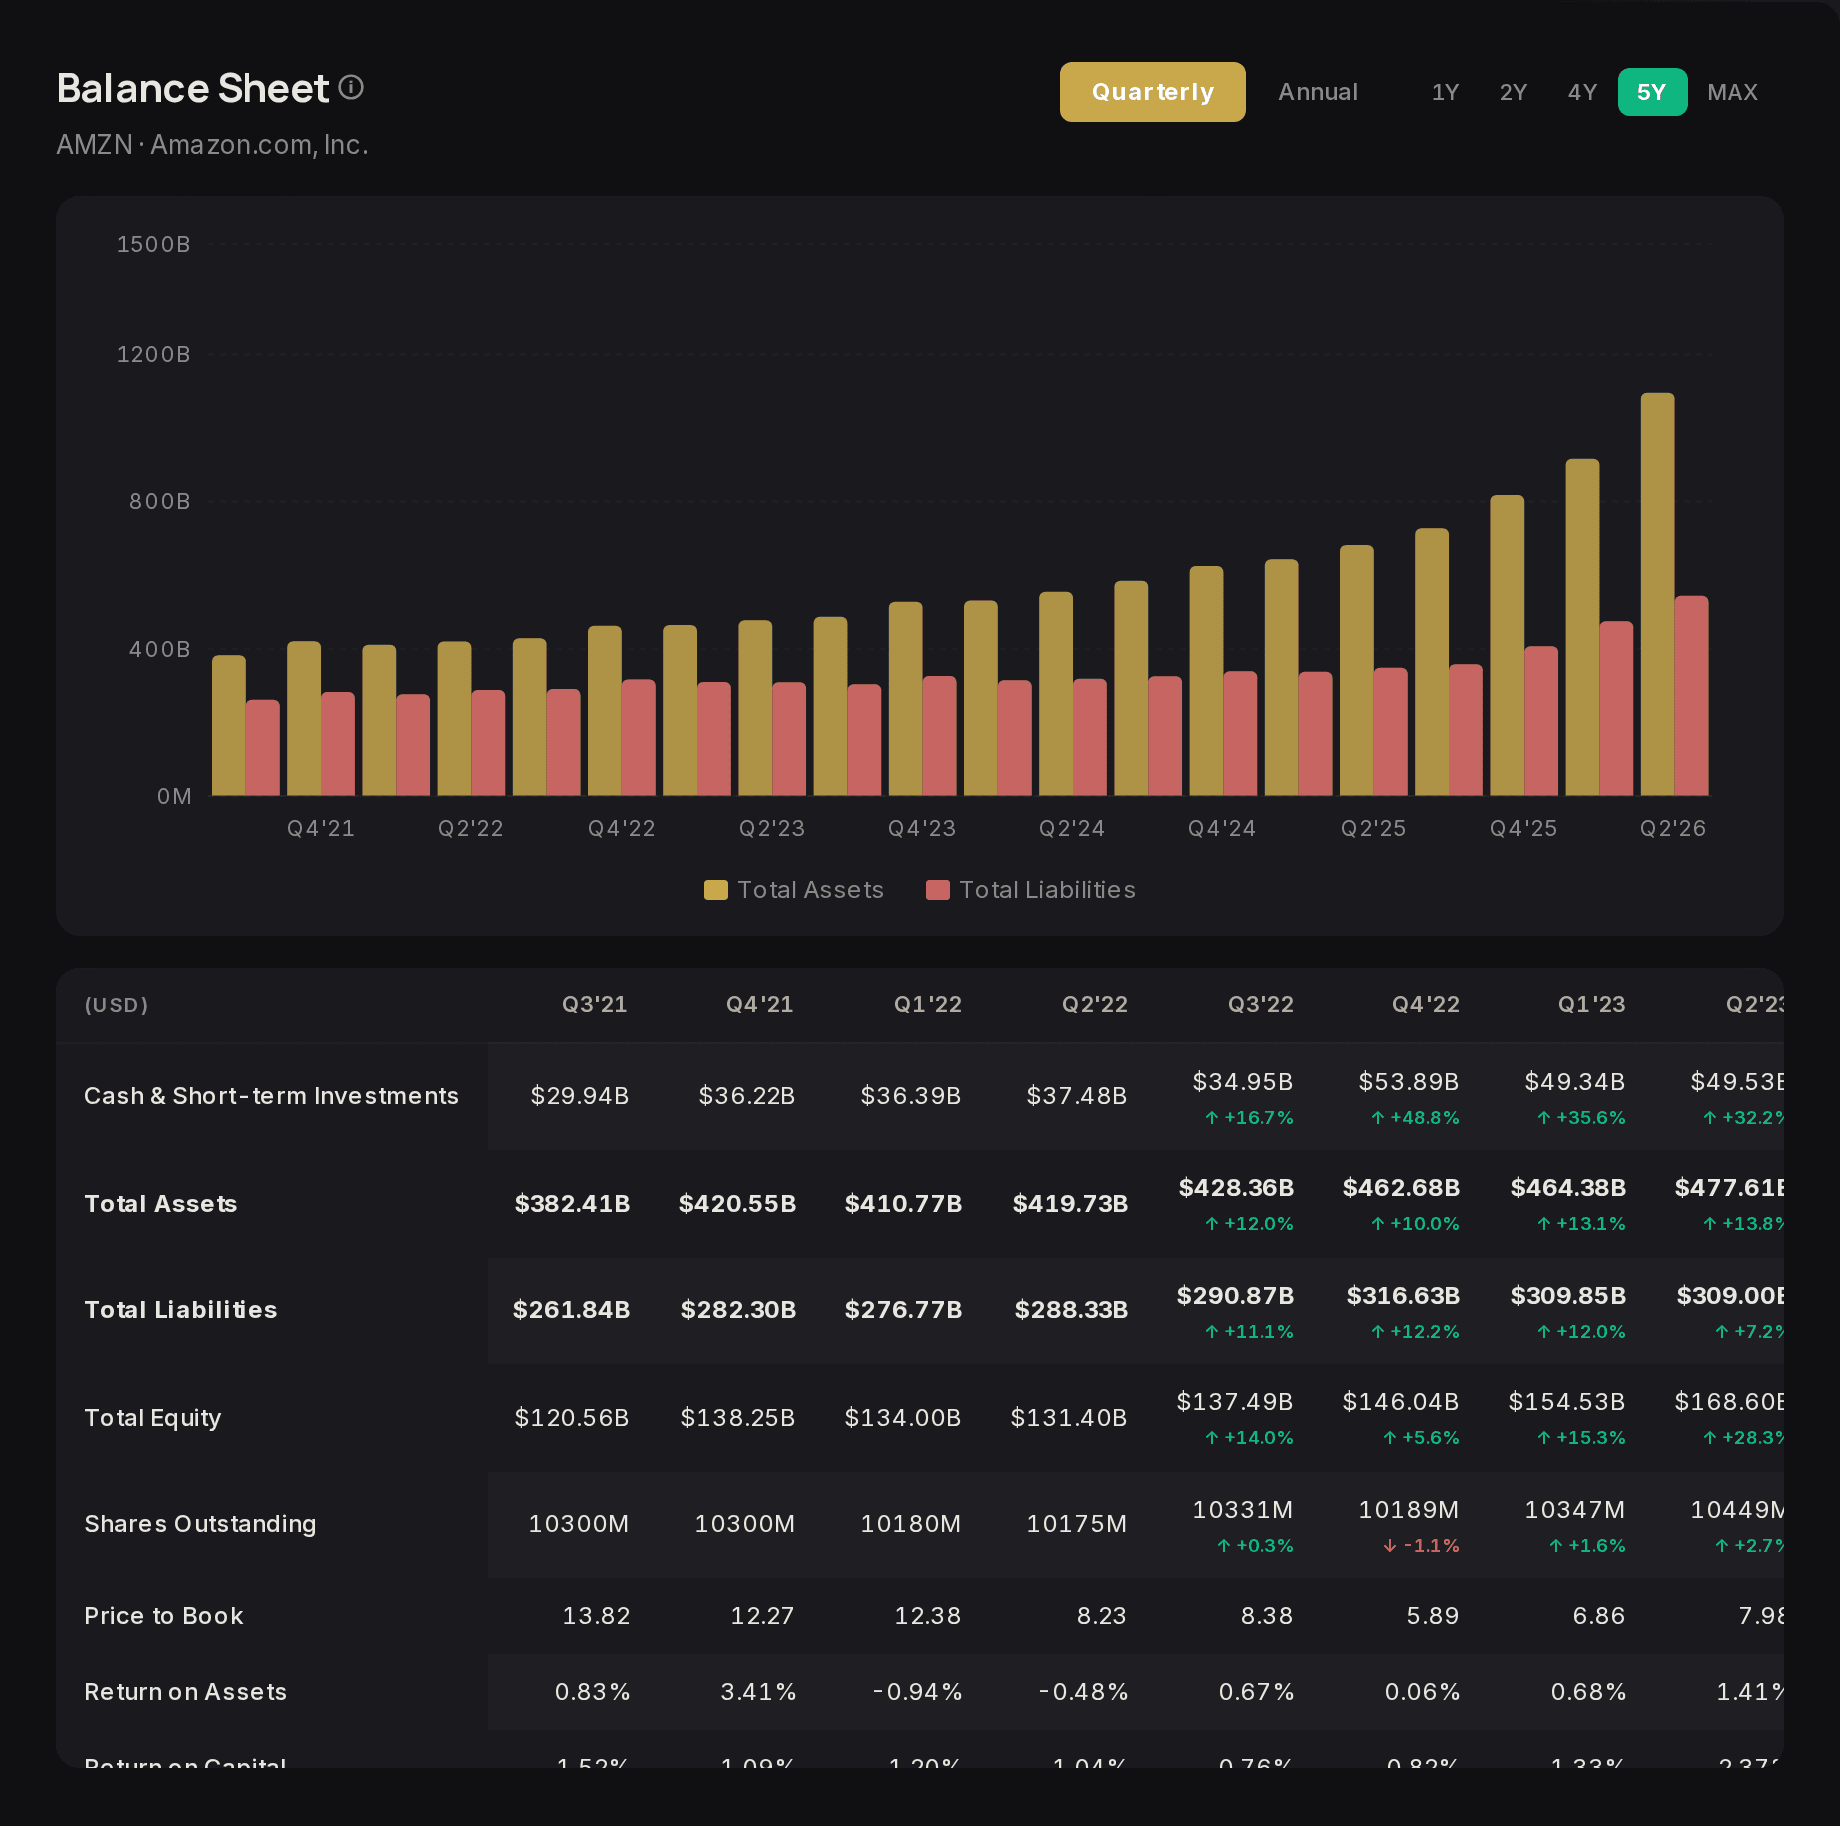
    Balance sheet

    What the company owns and what it owes.

    Figures as the company filed them with the SEC. We do not adjust them.

    The balance sheet section for AMZN: assets, liabilities and equity over five years.
  11. Page 11As filed

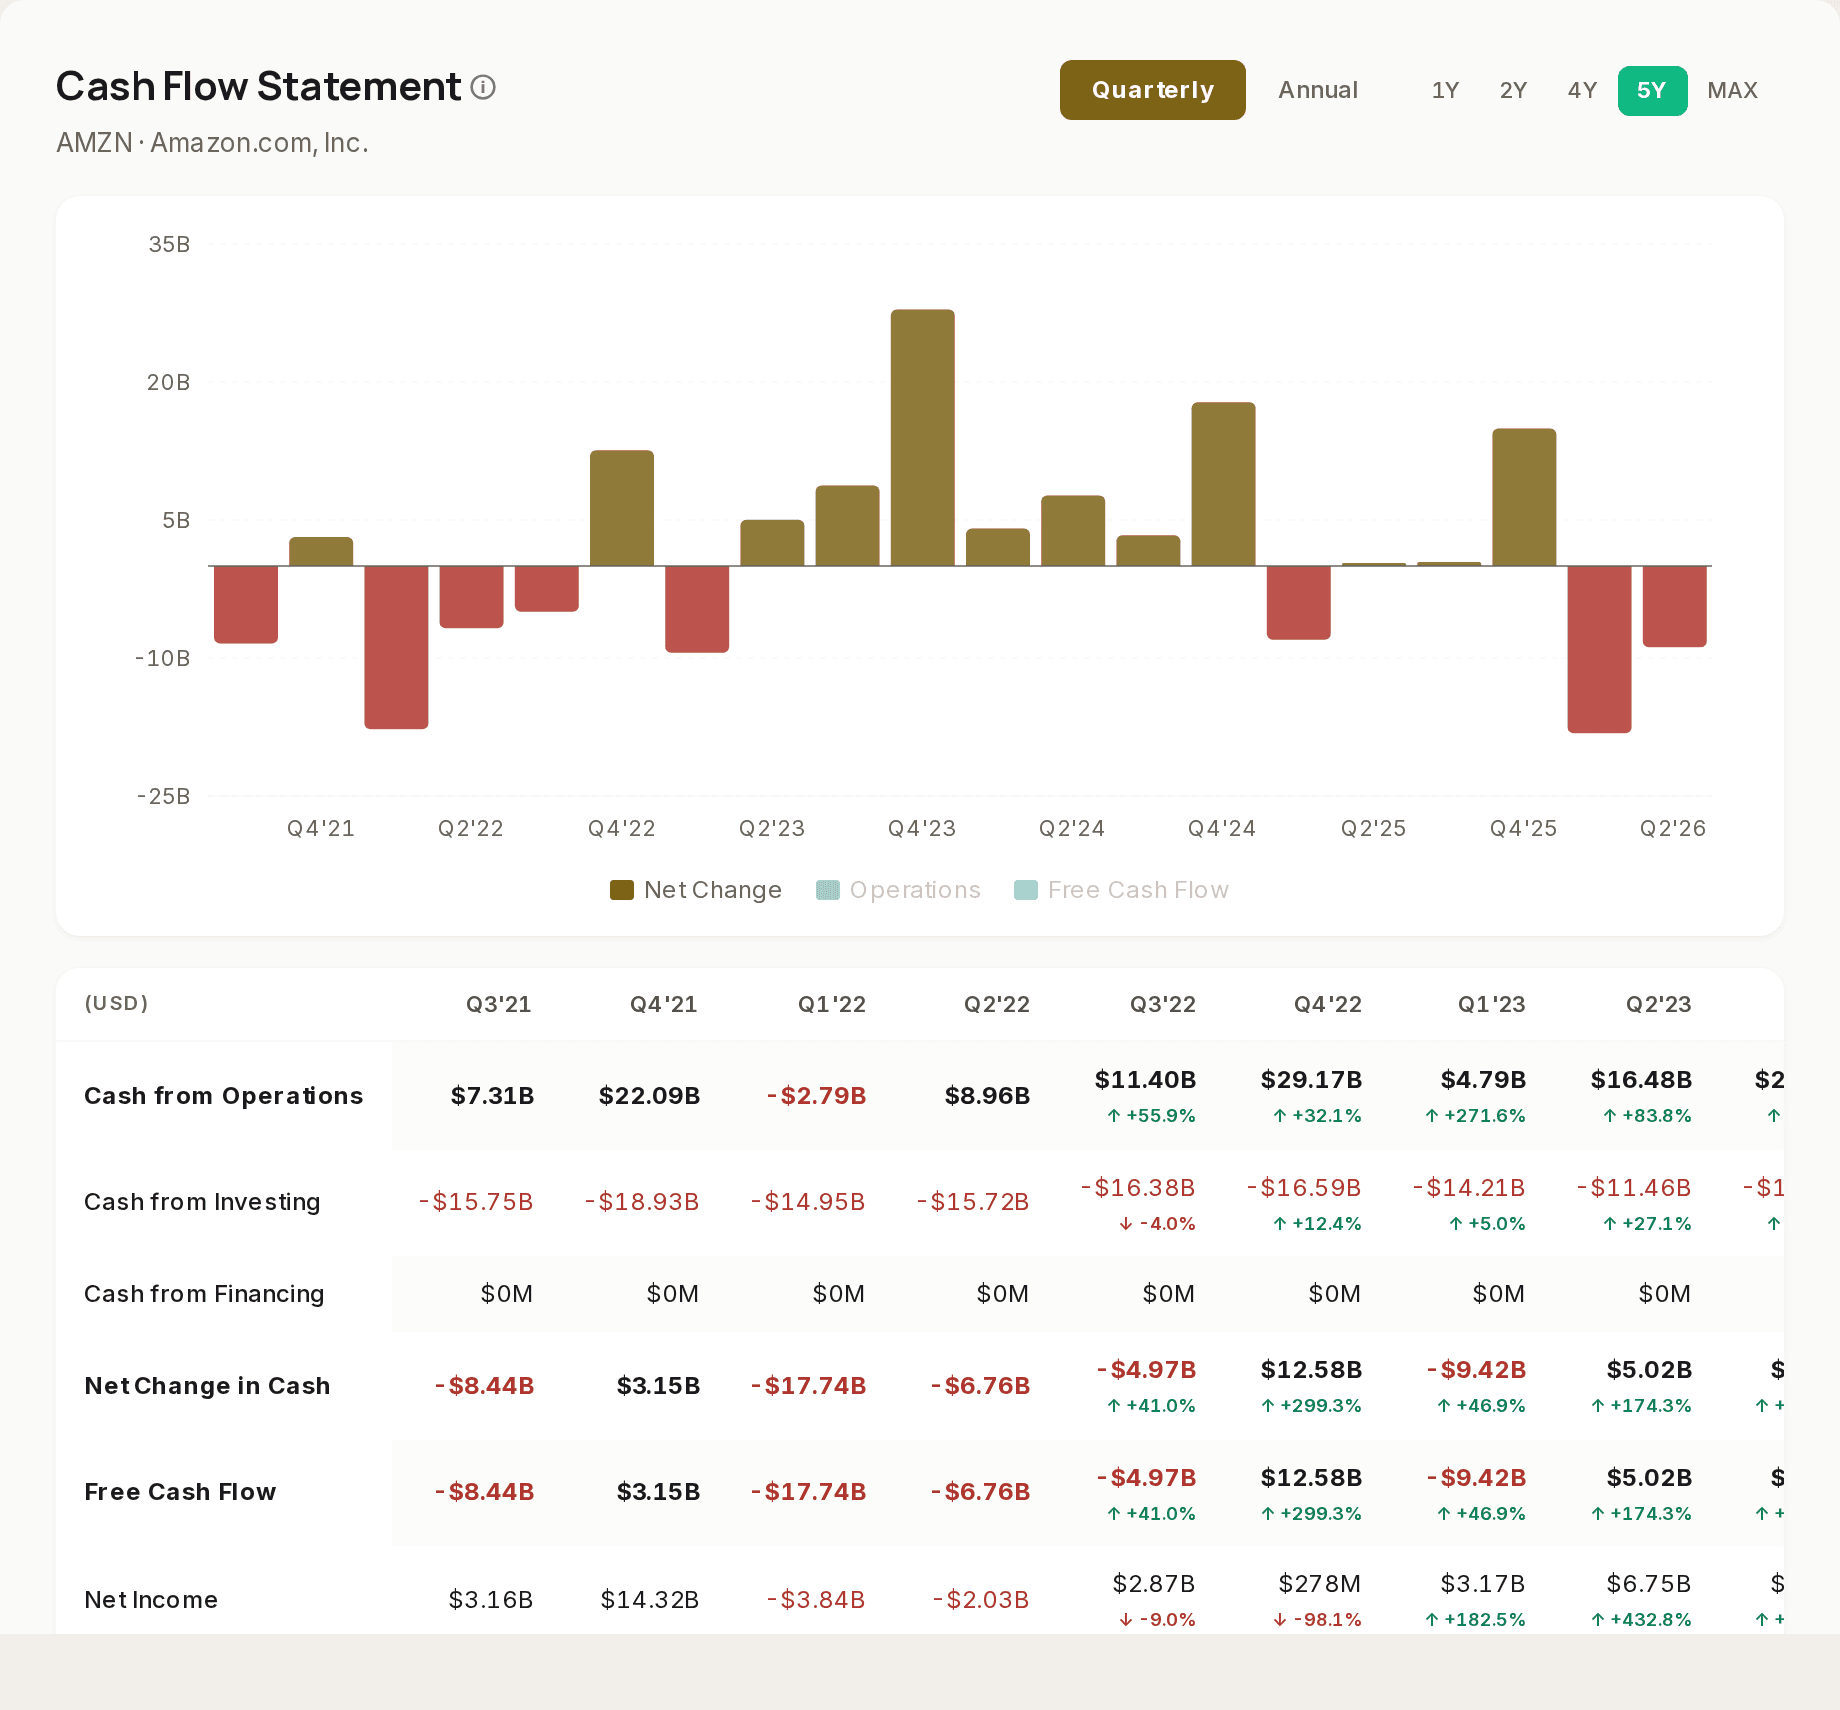
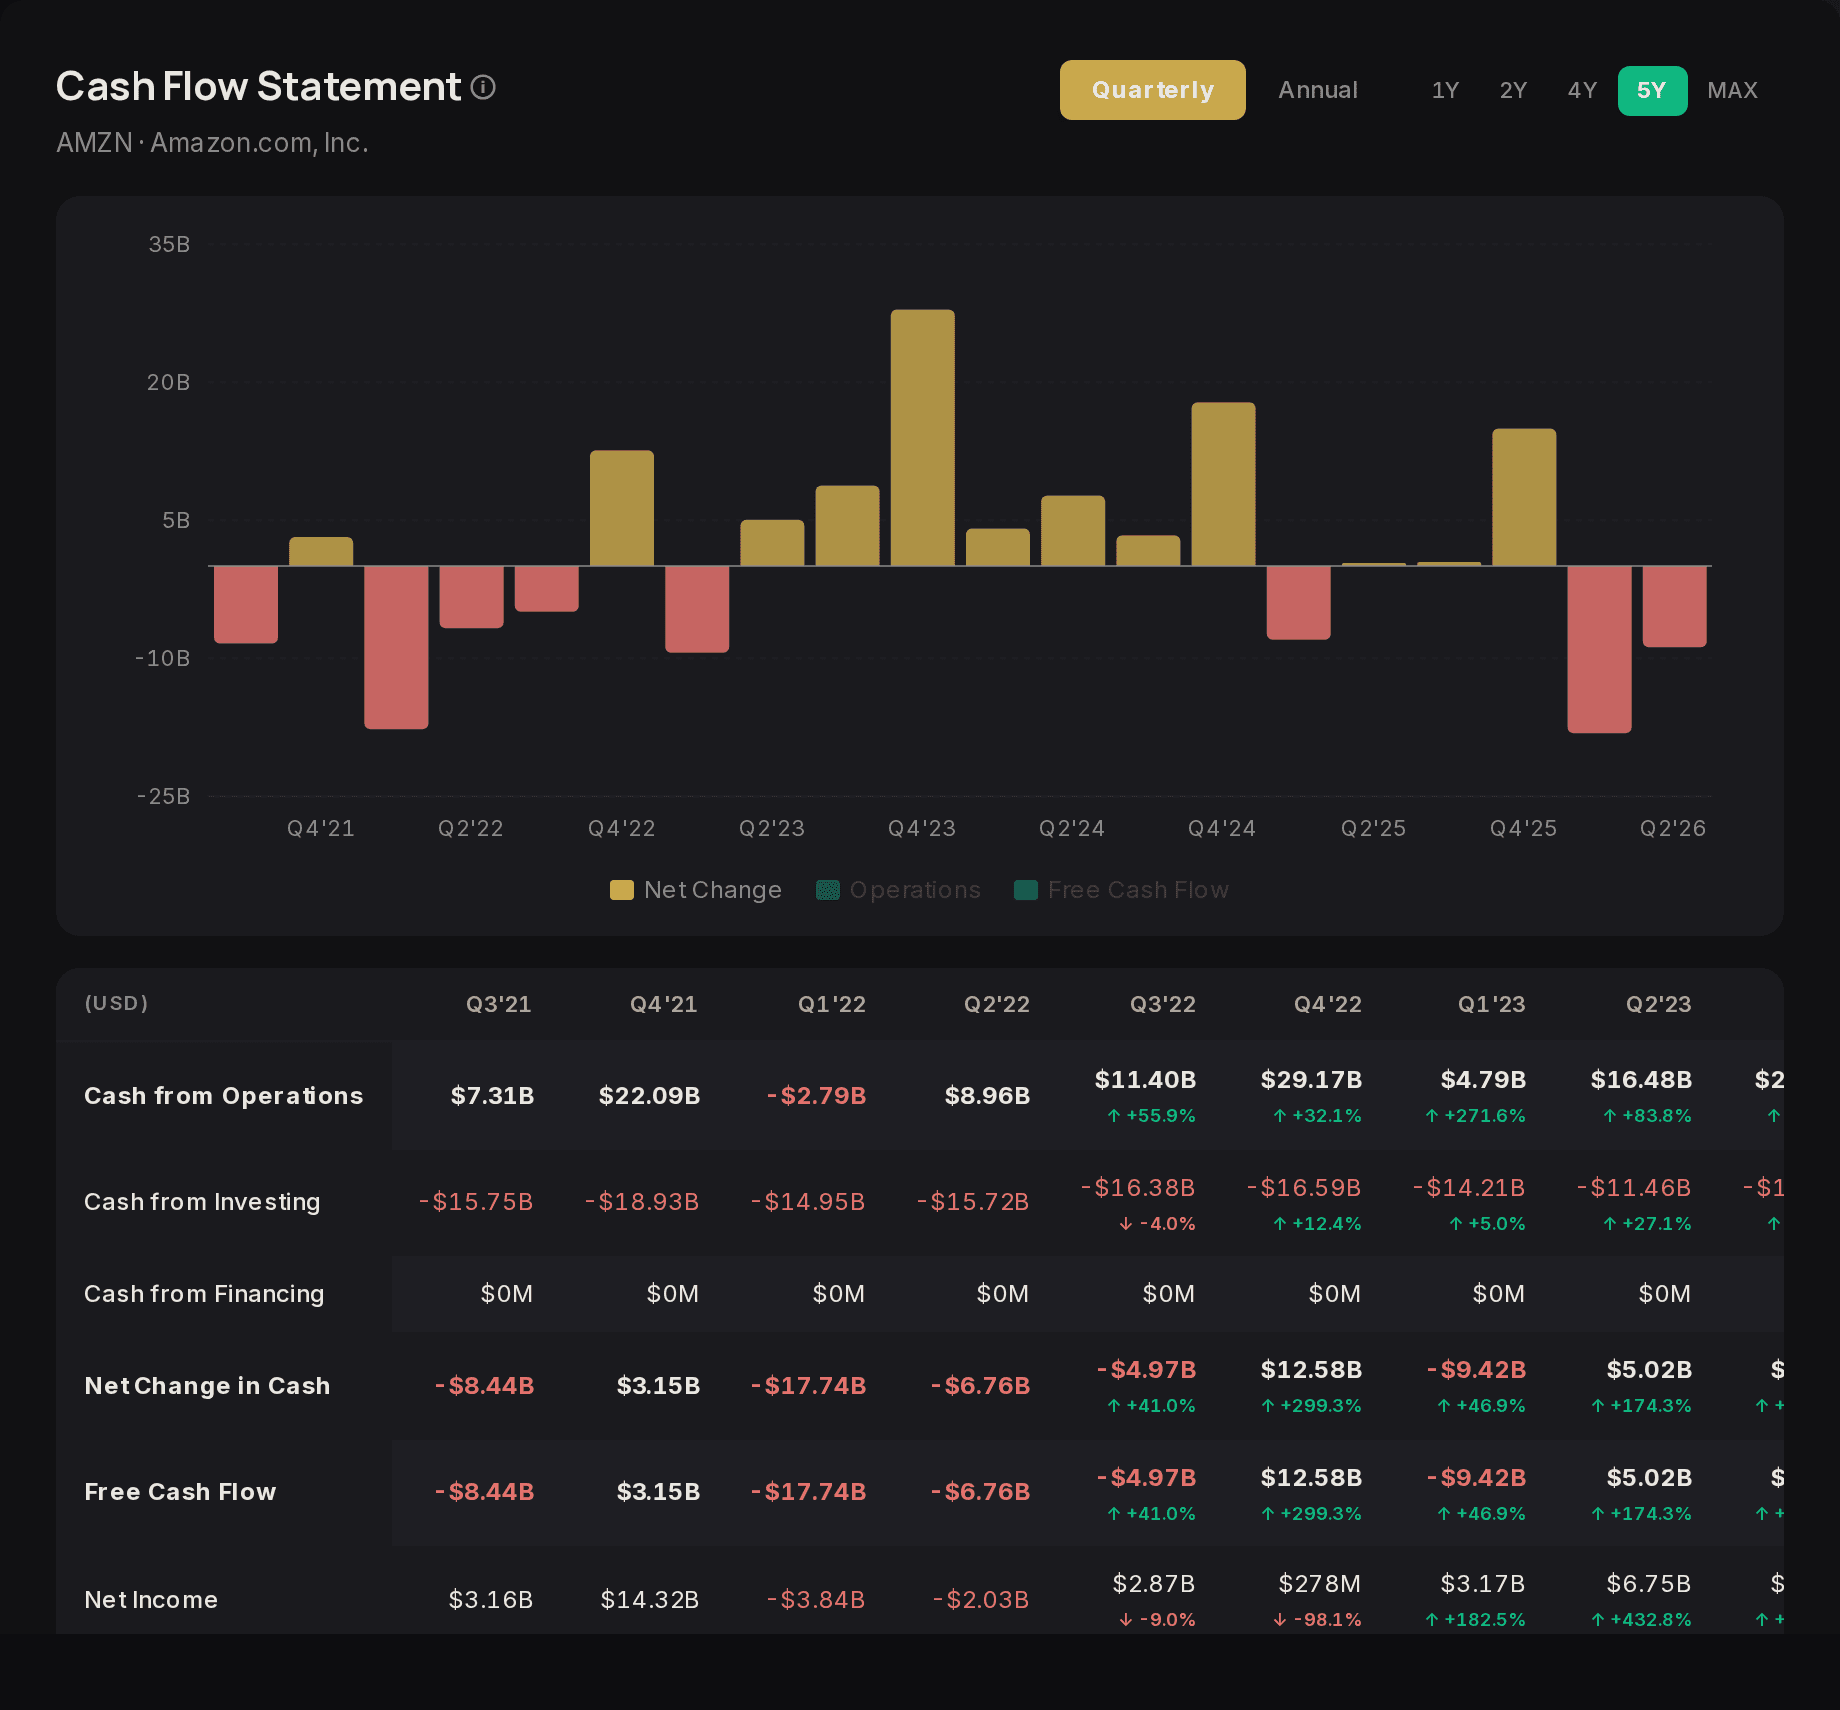
    Cash flow

    Where cash actually came from and went, which is harder to dress up than earnings.

    Figures as the company filed them with the SEC. We do not adjust them.

    The cash flow section for AMZN: operating cash flow, capital expenditure and free cash flow over five years.
  12. Page 12As filed

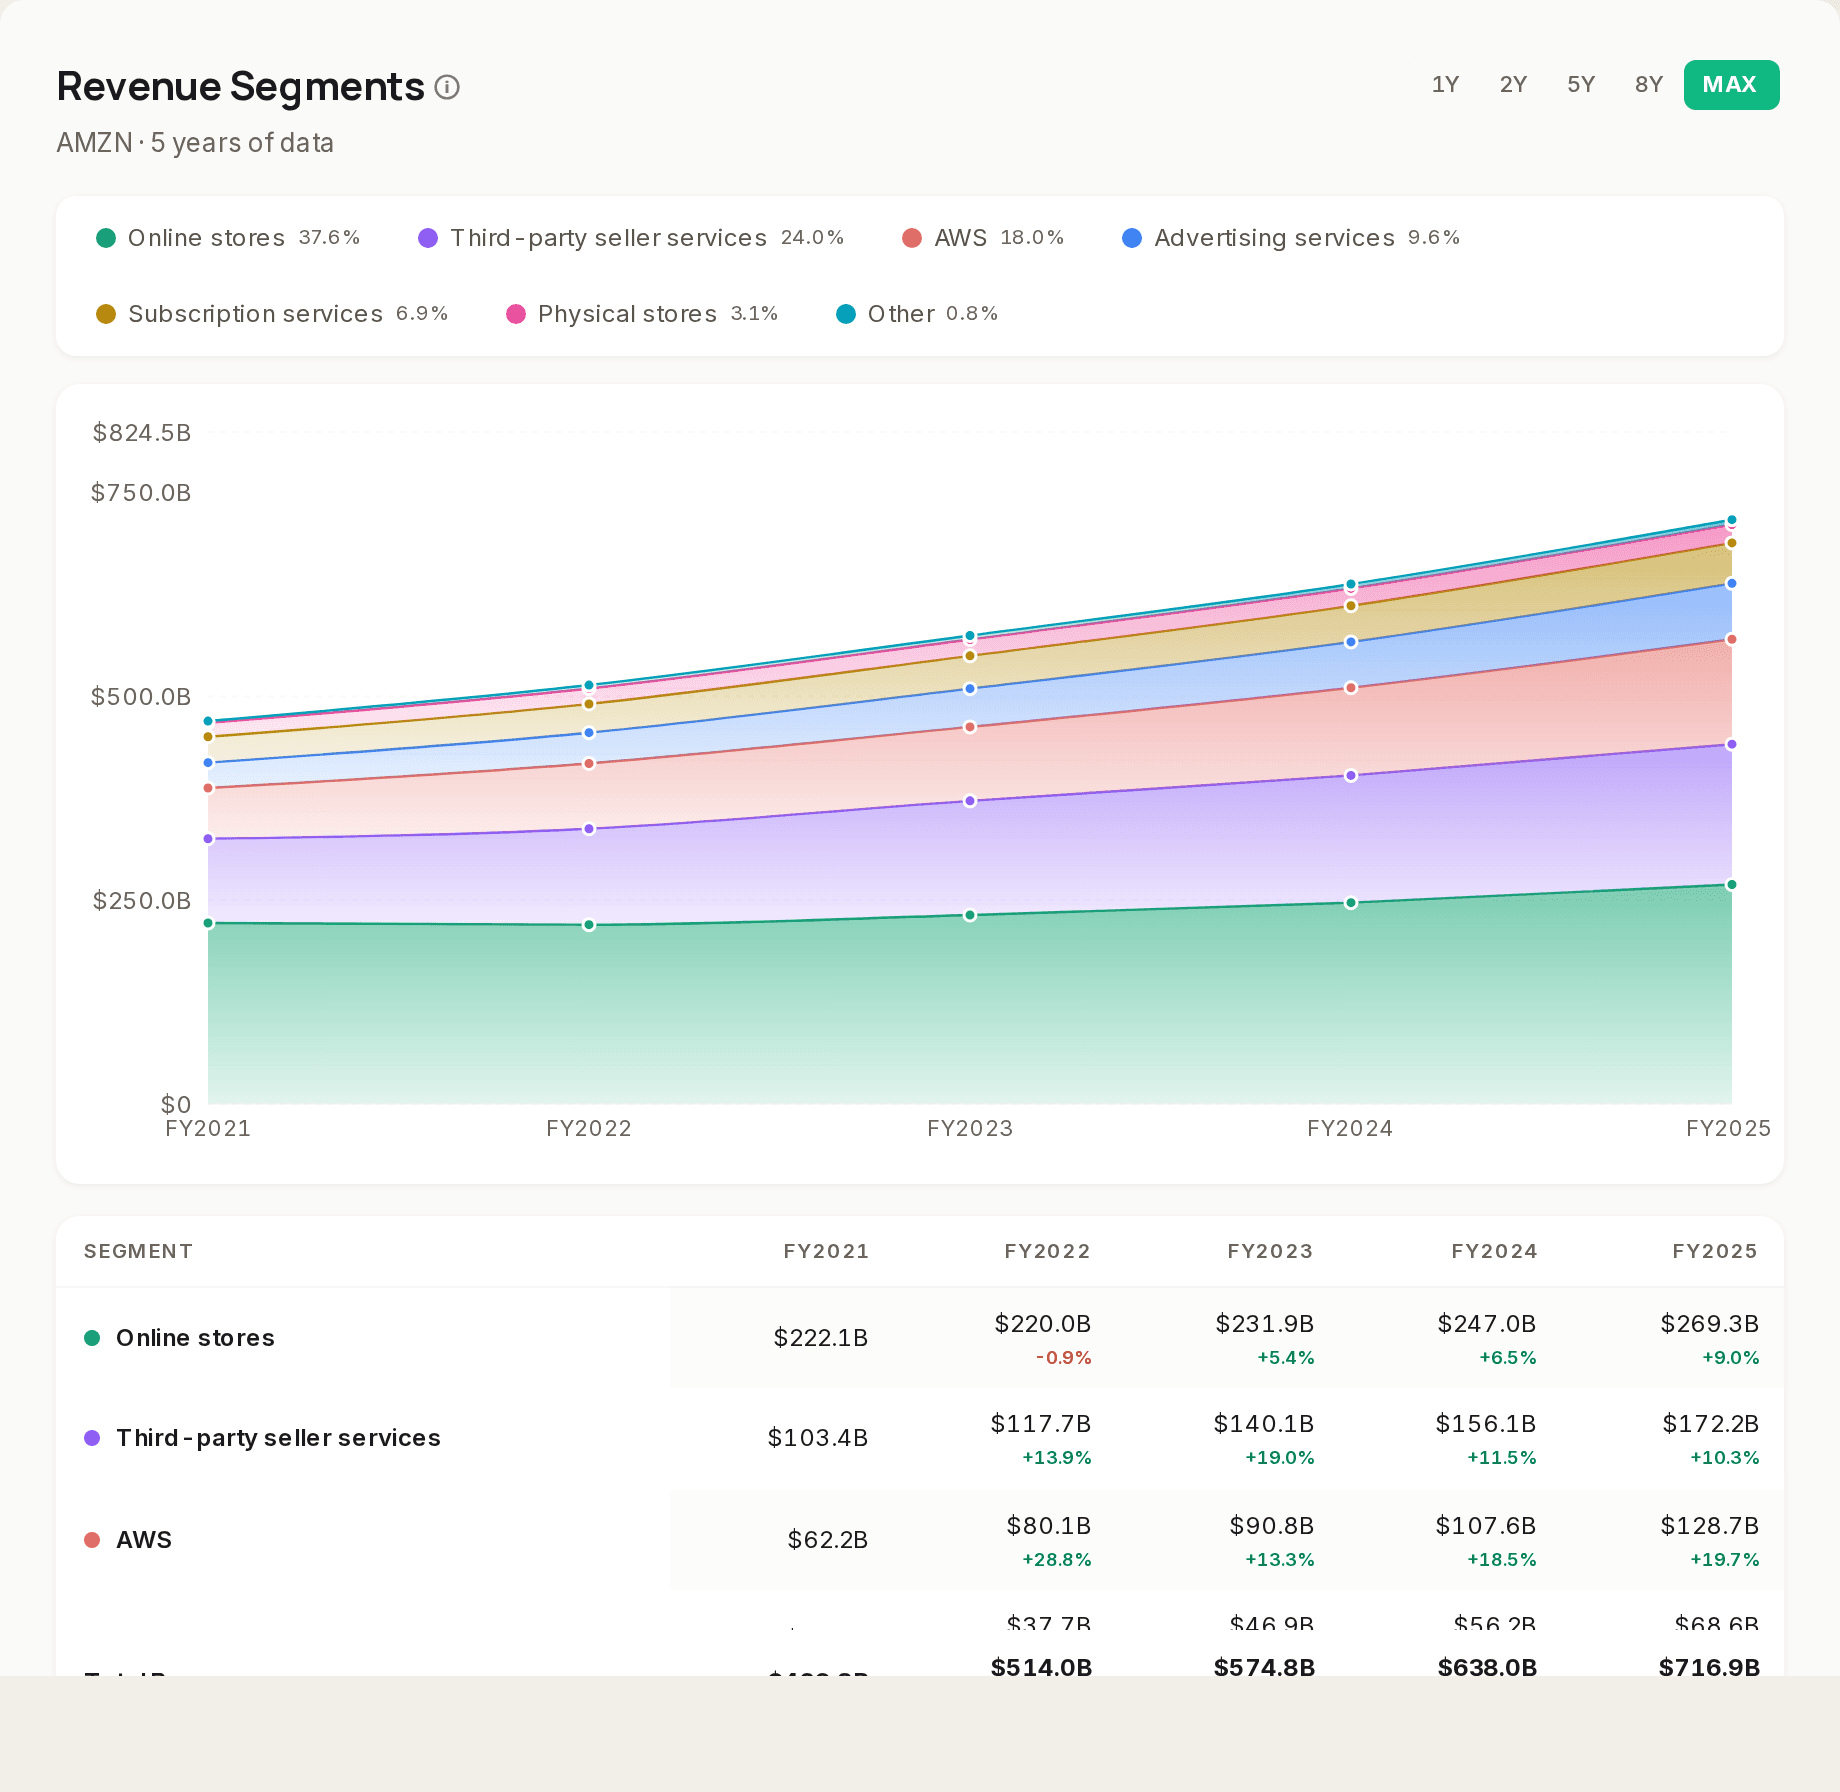
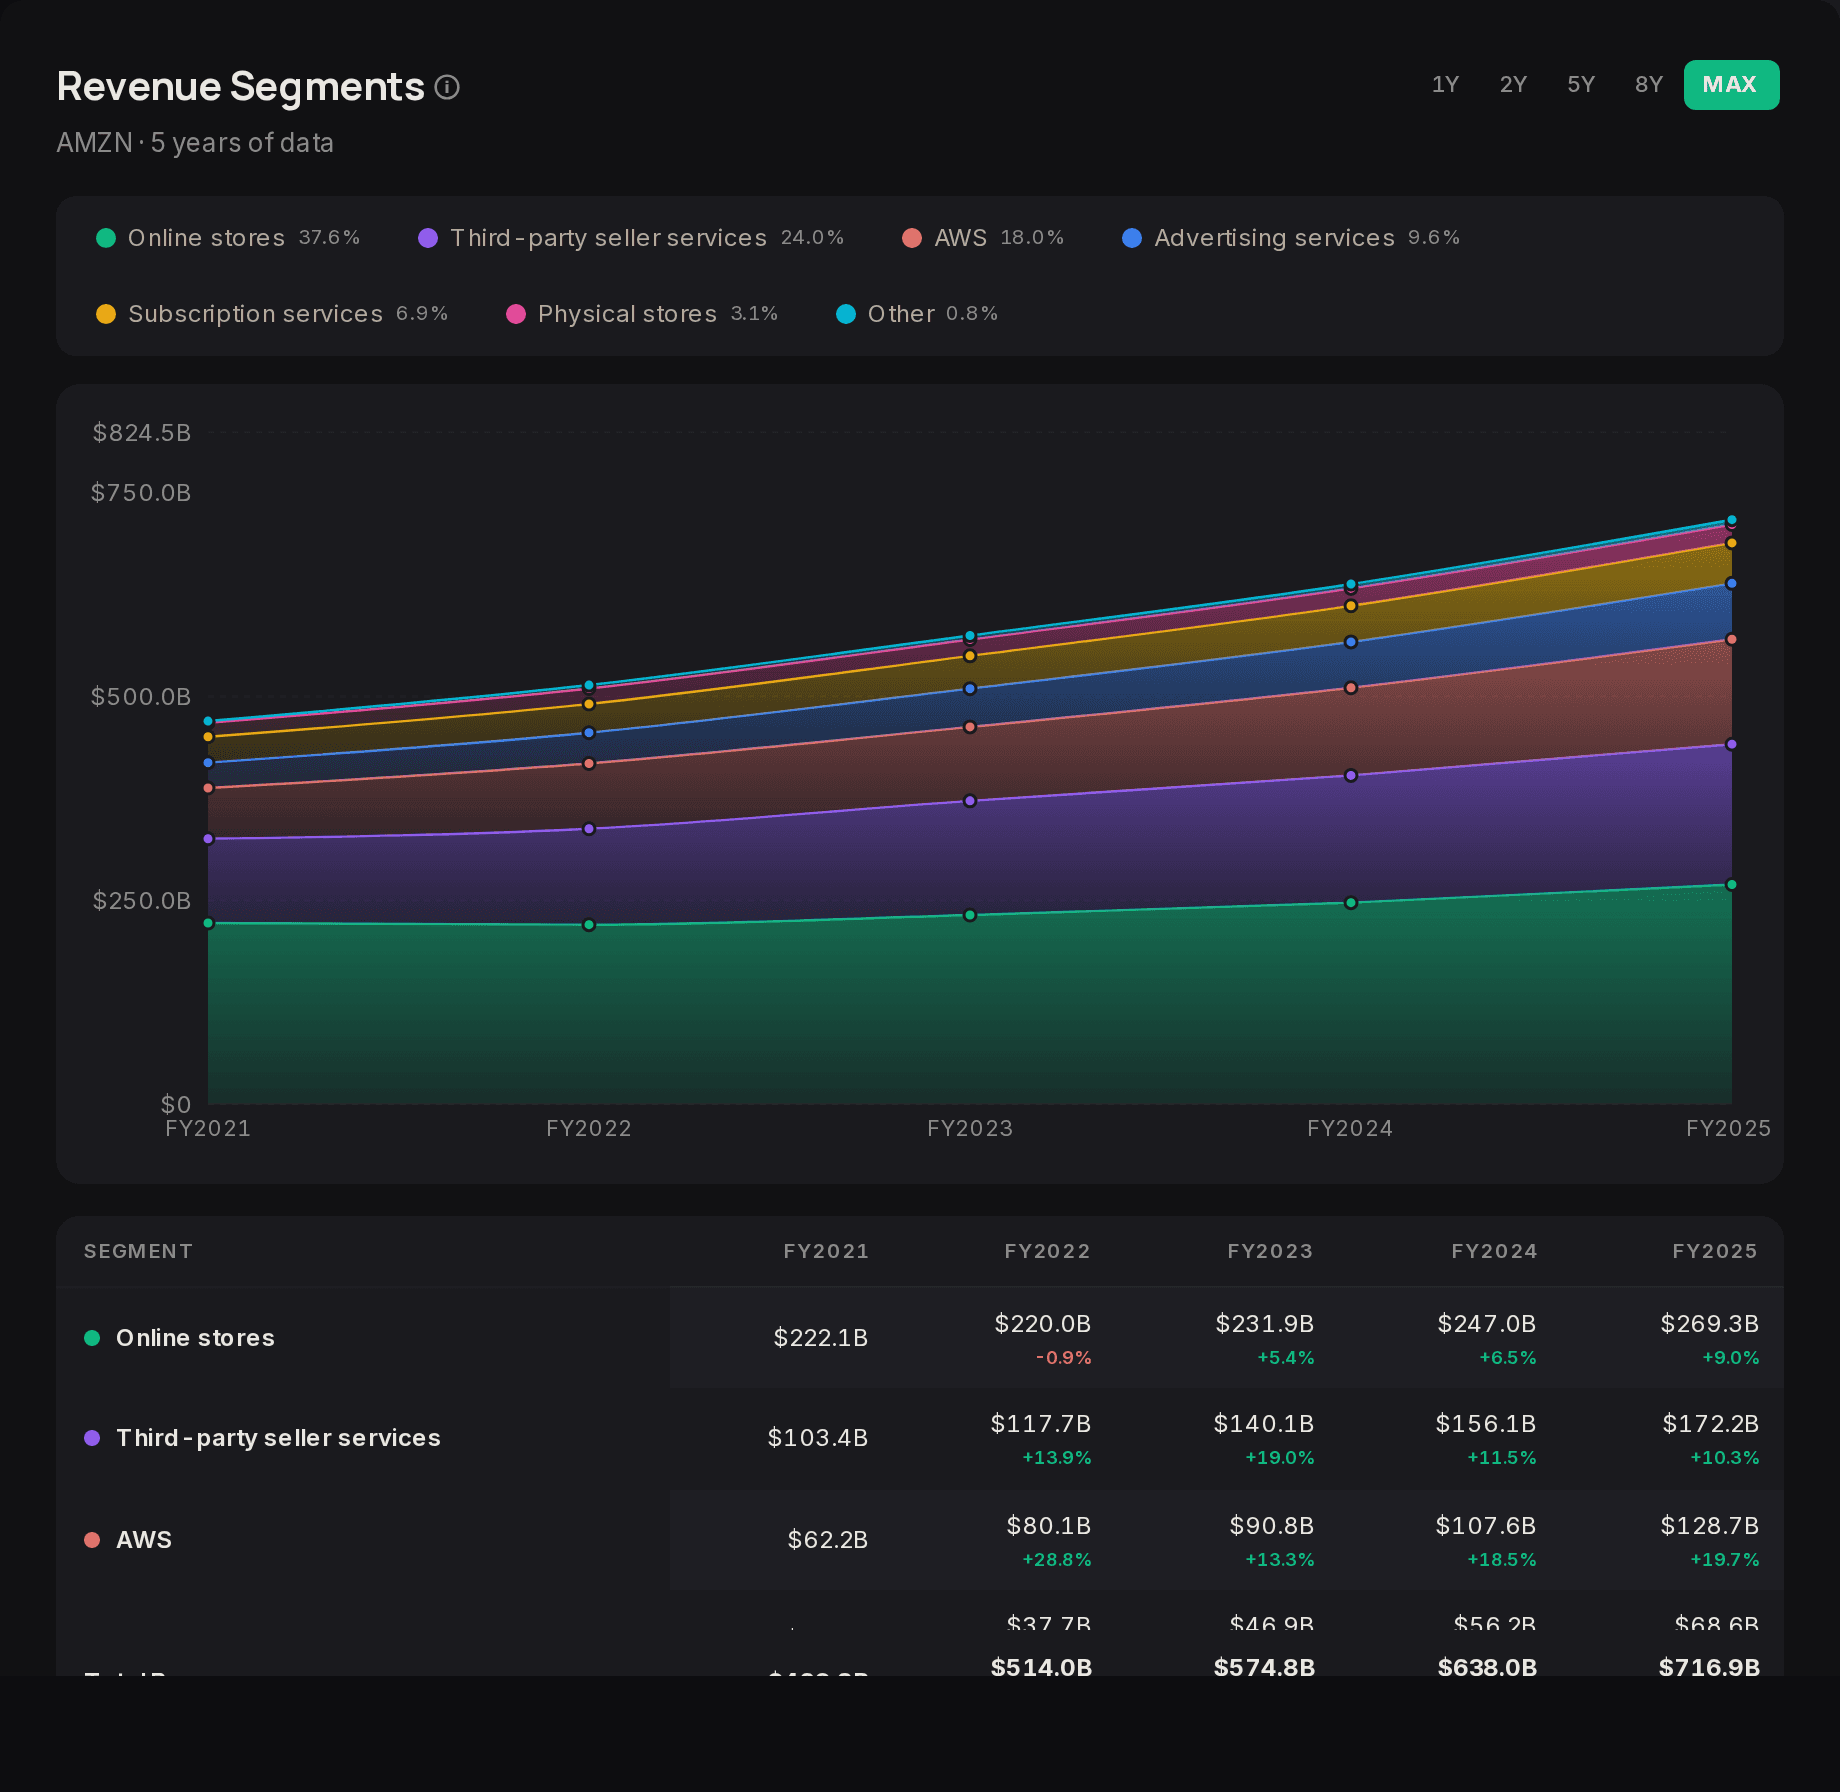
    Where the money is made: segments

    Revenue by business line across five fiscal years, with each line's share and growth.

    Figures as the company filed them with the SEC. We do not adjust them.

    AMZN revenue by segment FY2021 to FY2025: online stores 37.6%, third-party seller services 24.0%, AWS 18.0%, advertising 9.6%, subscriptions 6.9%, physical stores 3.1%, other 0.8%, with a table per segment and year.

    How to read it. The honest answer to what a company actually does. A company whose profit depends on one segment moves with that segment, whatever the brand suggests.

  13. Page 13As filed

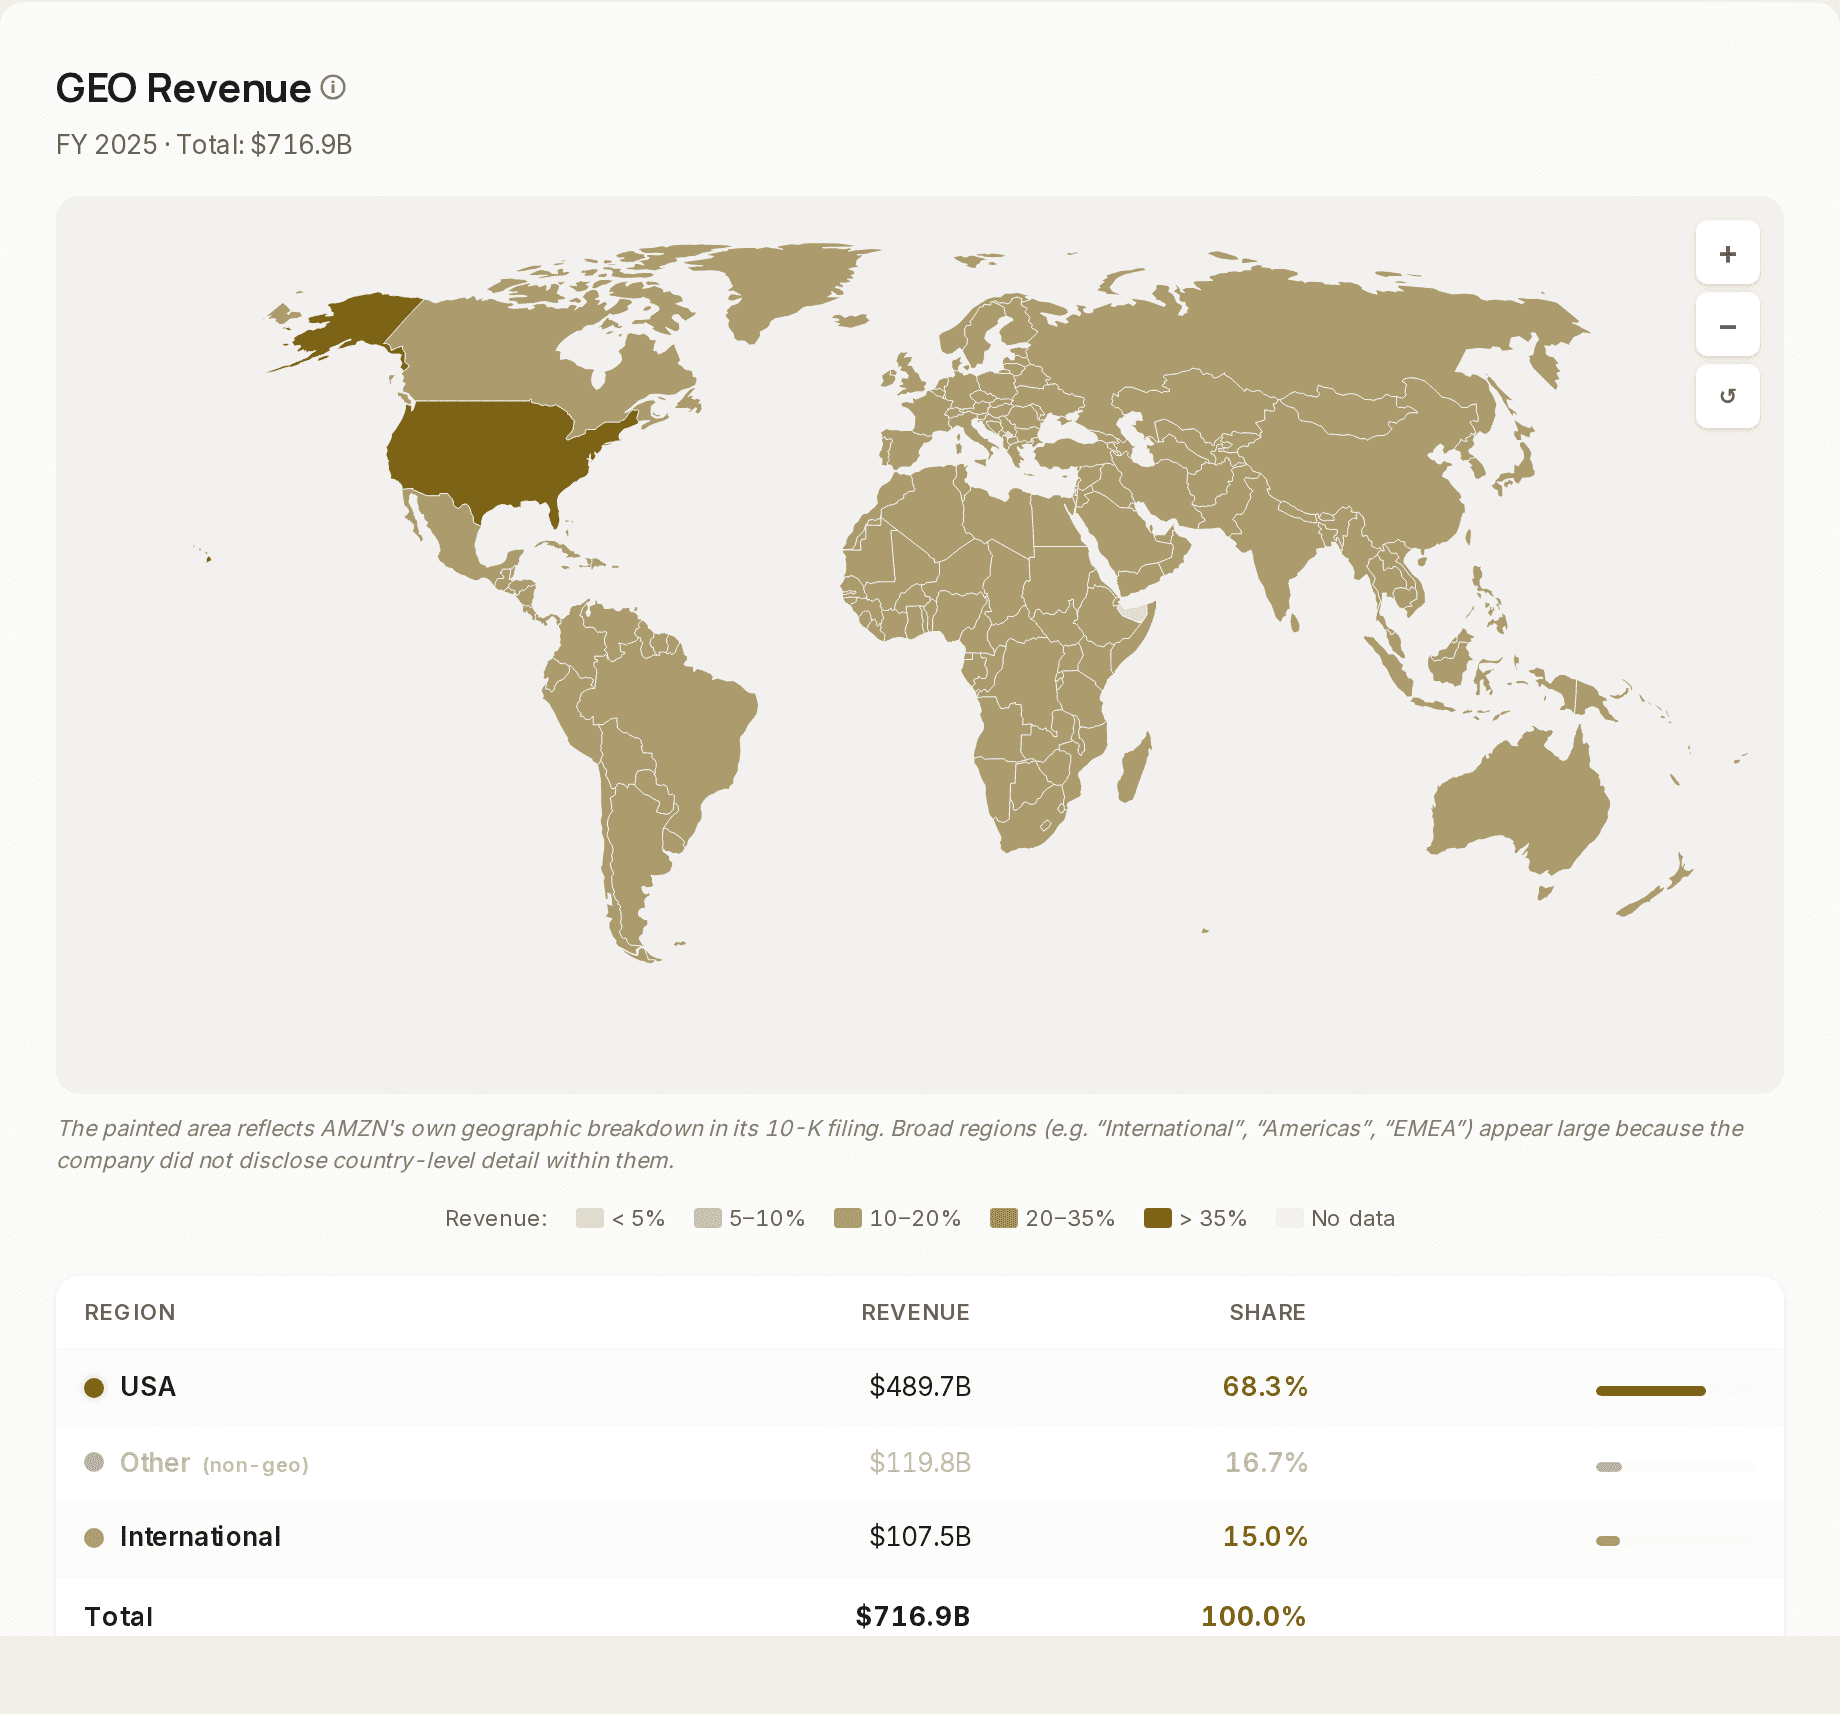
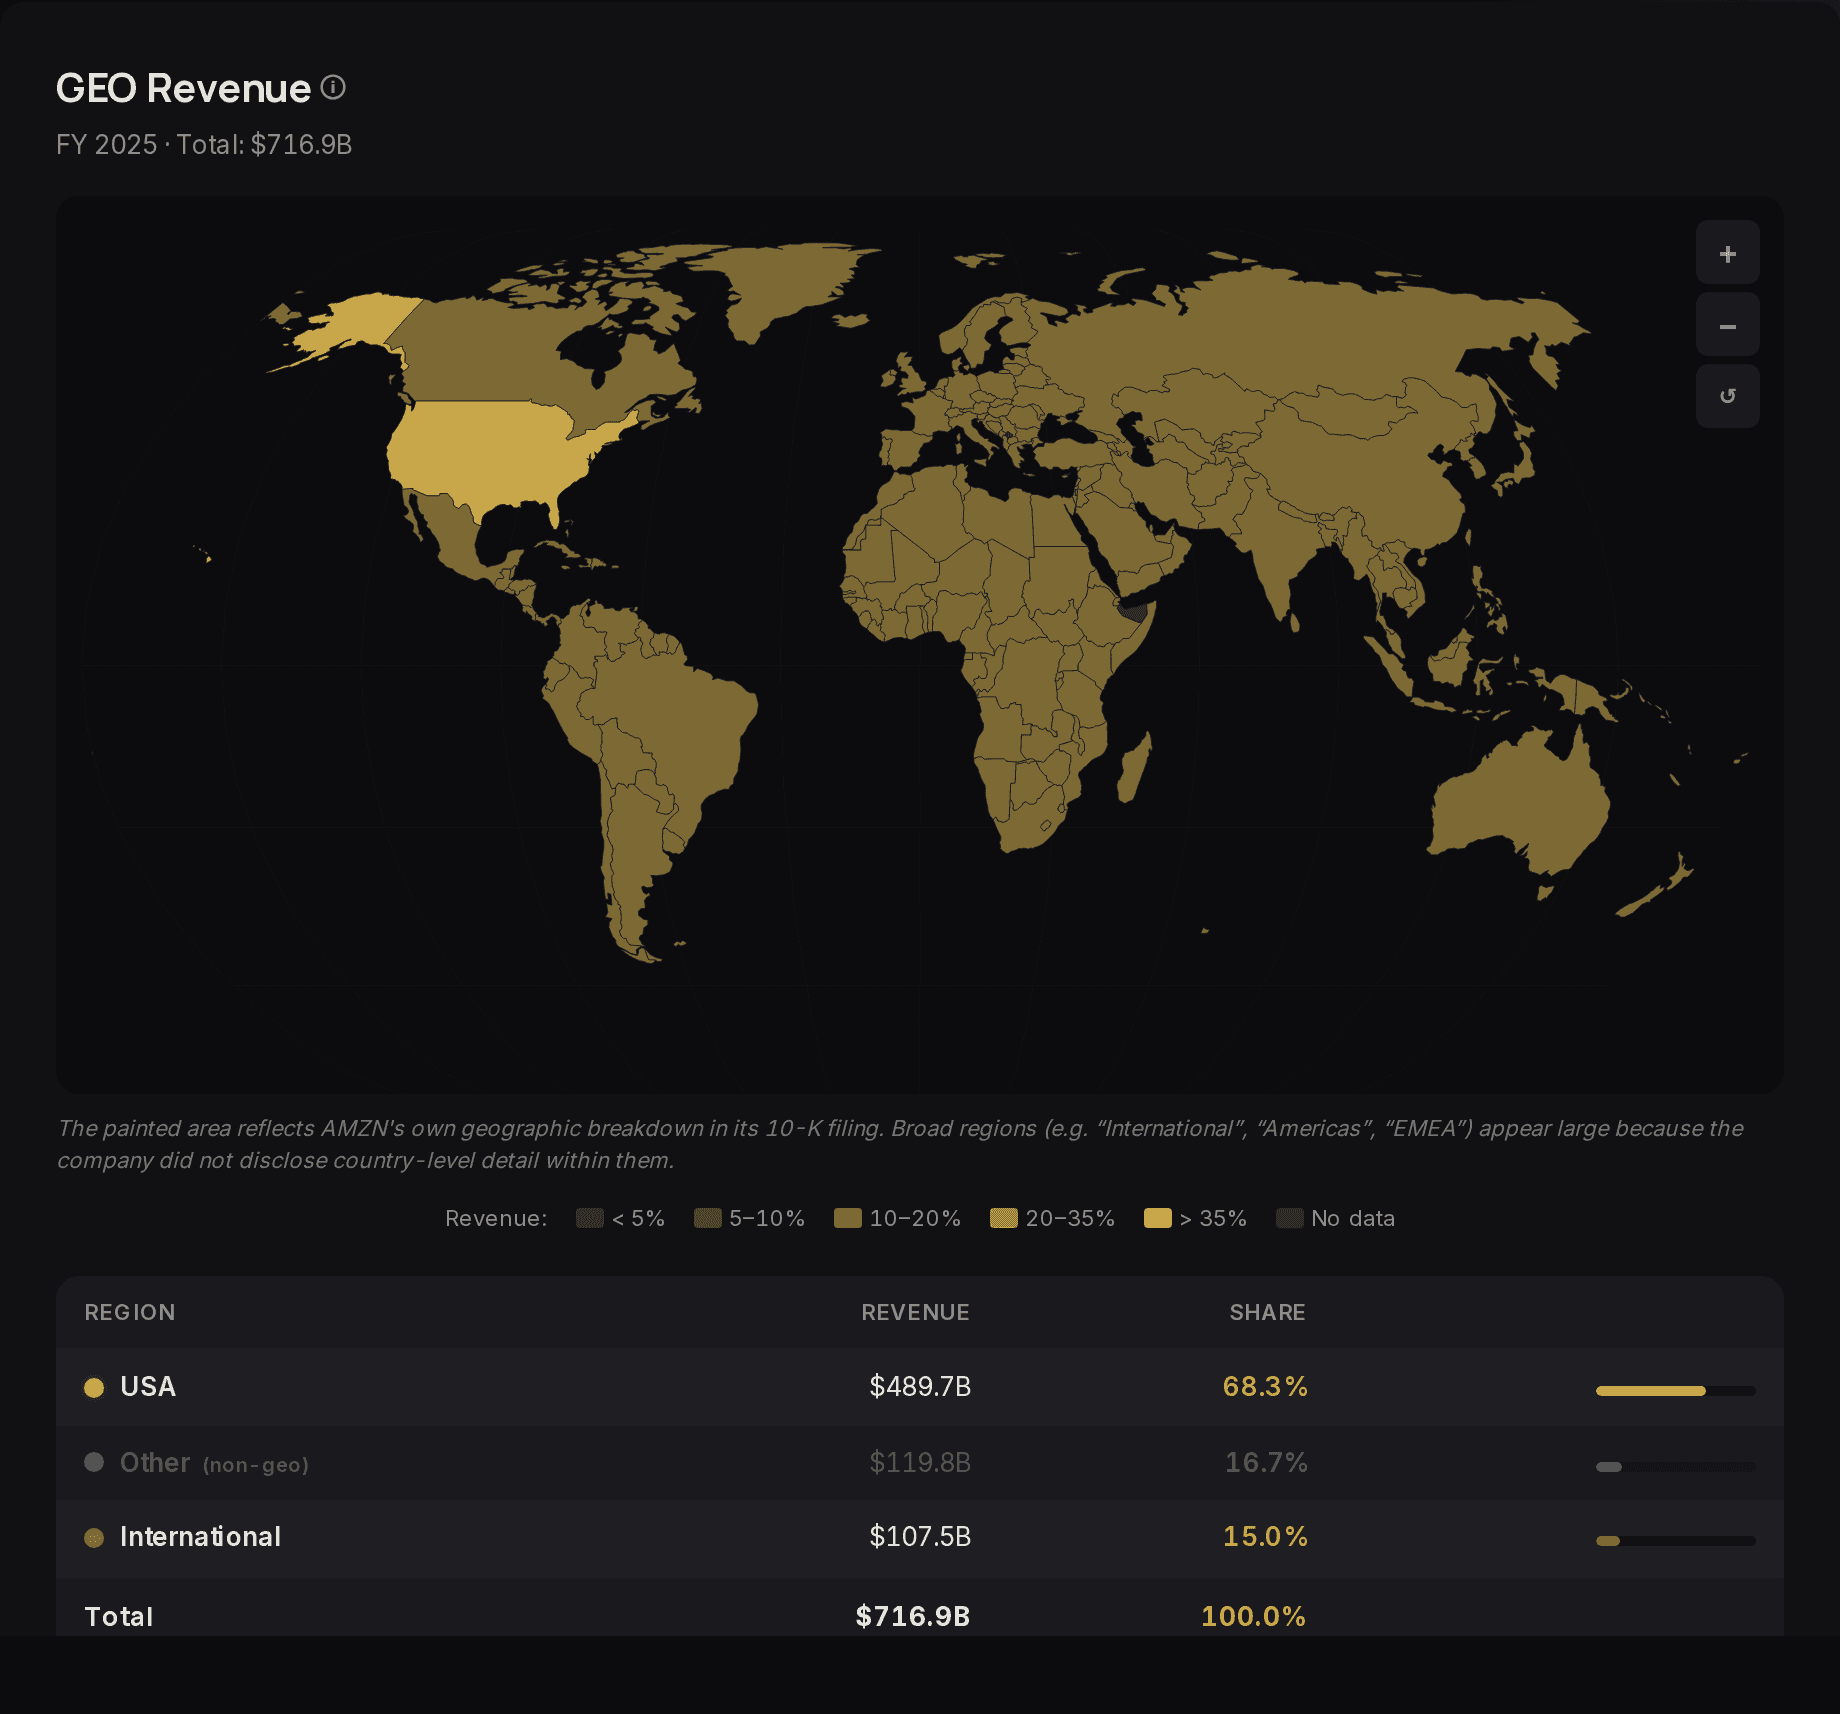
    Where the money is made: geography

    The same revenue, split by region.

    Figures as the company filed them with the SEC. We do not adjust them.

    AMZN revenue by geography on a world map with a table per region.

    How to read it. Heavy concentration in one market is a risk the income statement never shows: currency, regulation and demand in that one place become the company's problem too.

  14. Page 14From filings

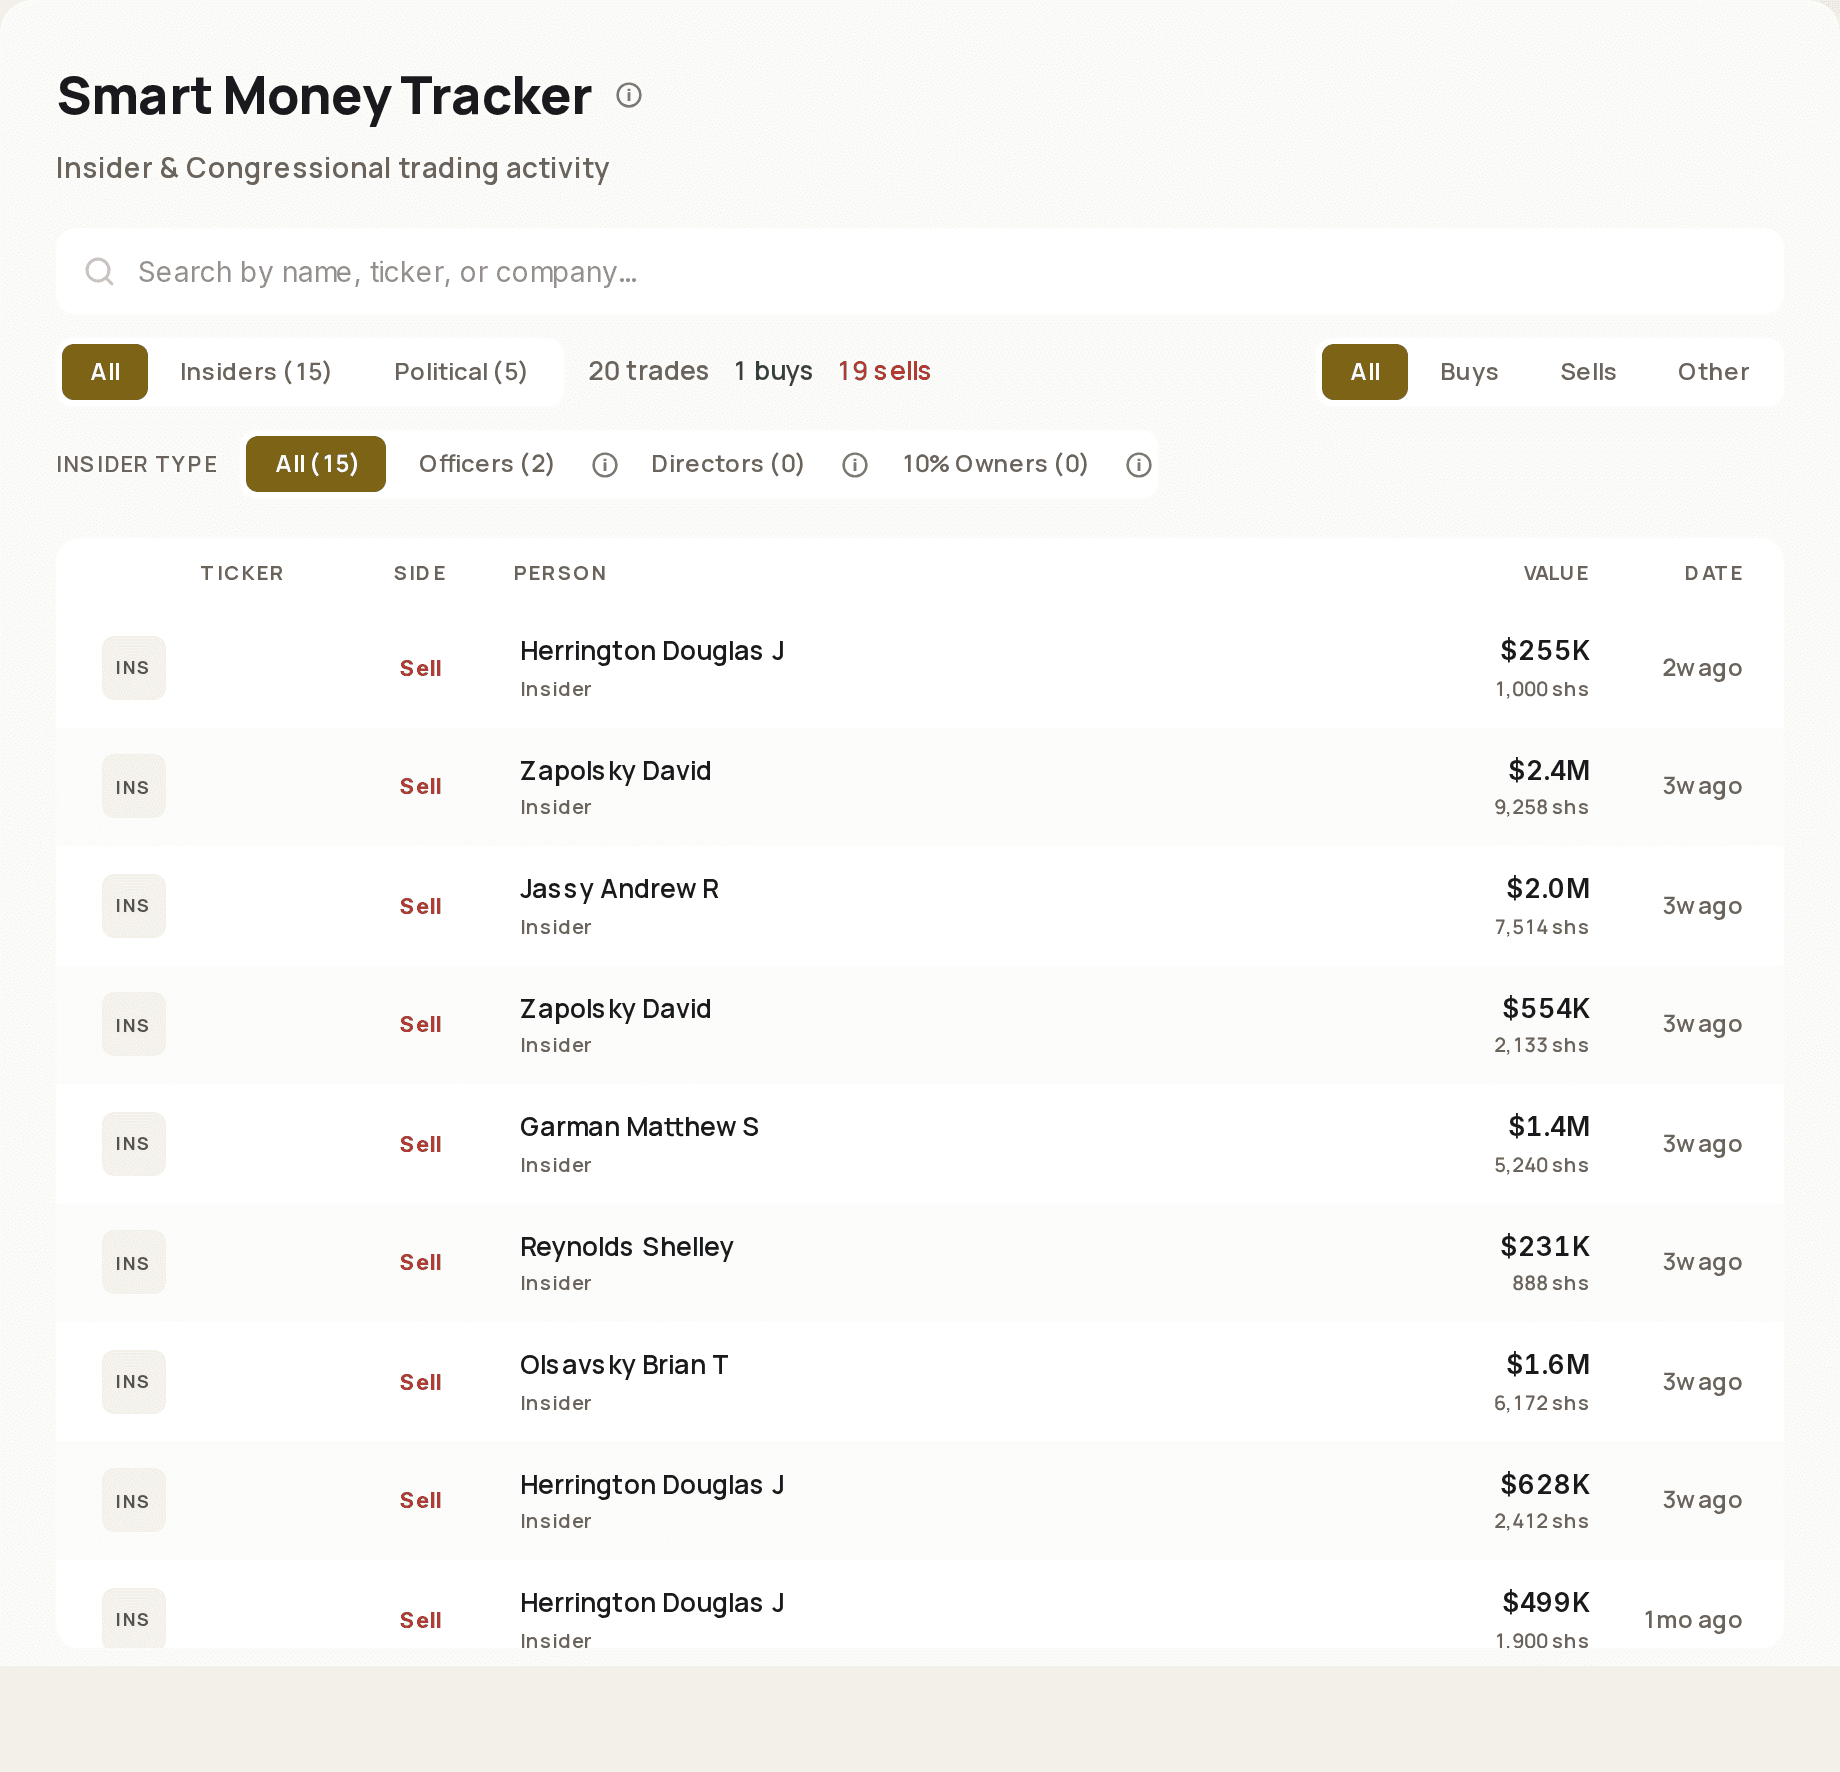
    Who is buying their own stock

    Insider and congressional filings on the company, each with how old it is.

    Insider Form 4s and congressional disclosures, each with its age.

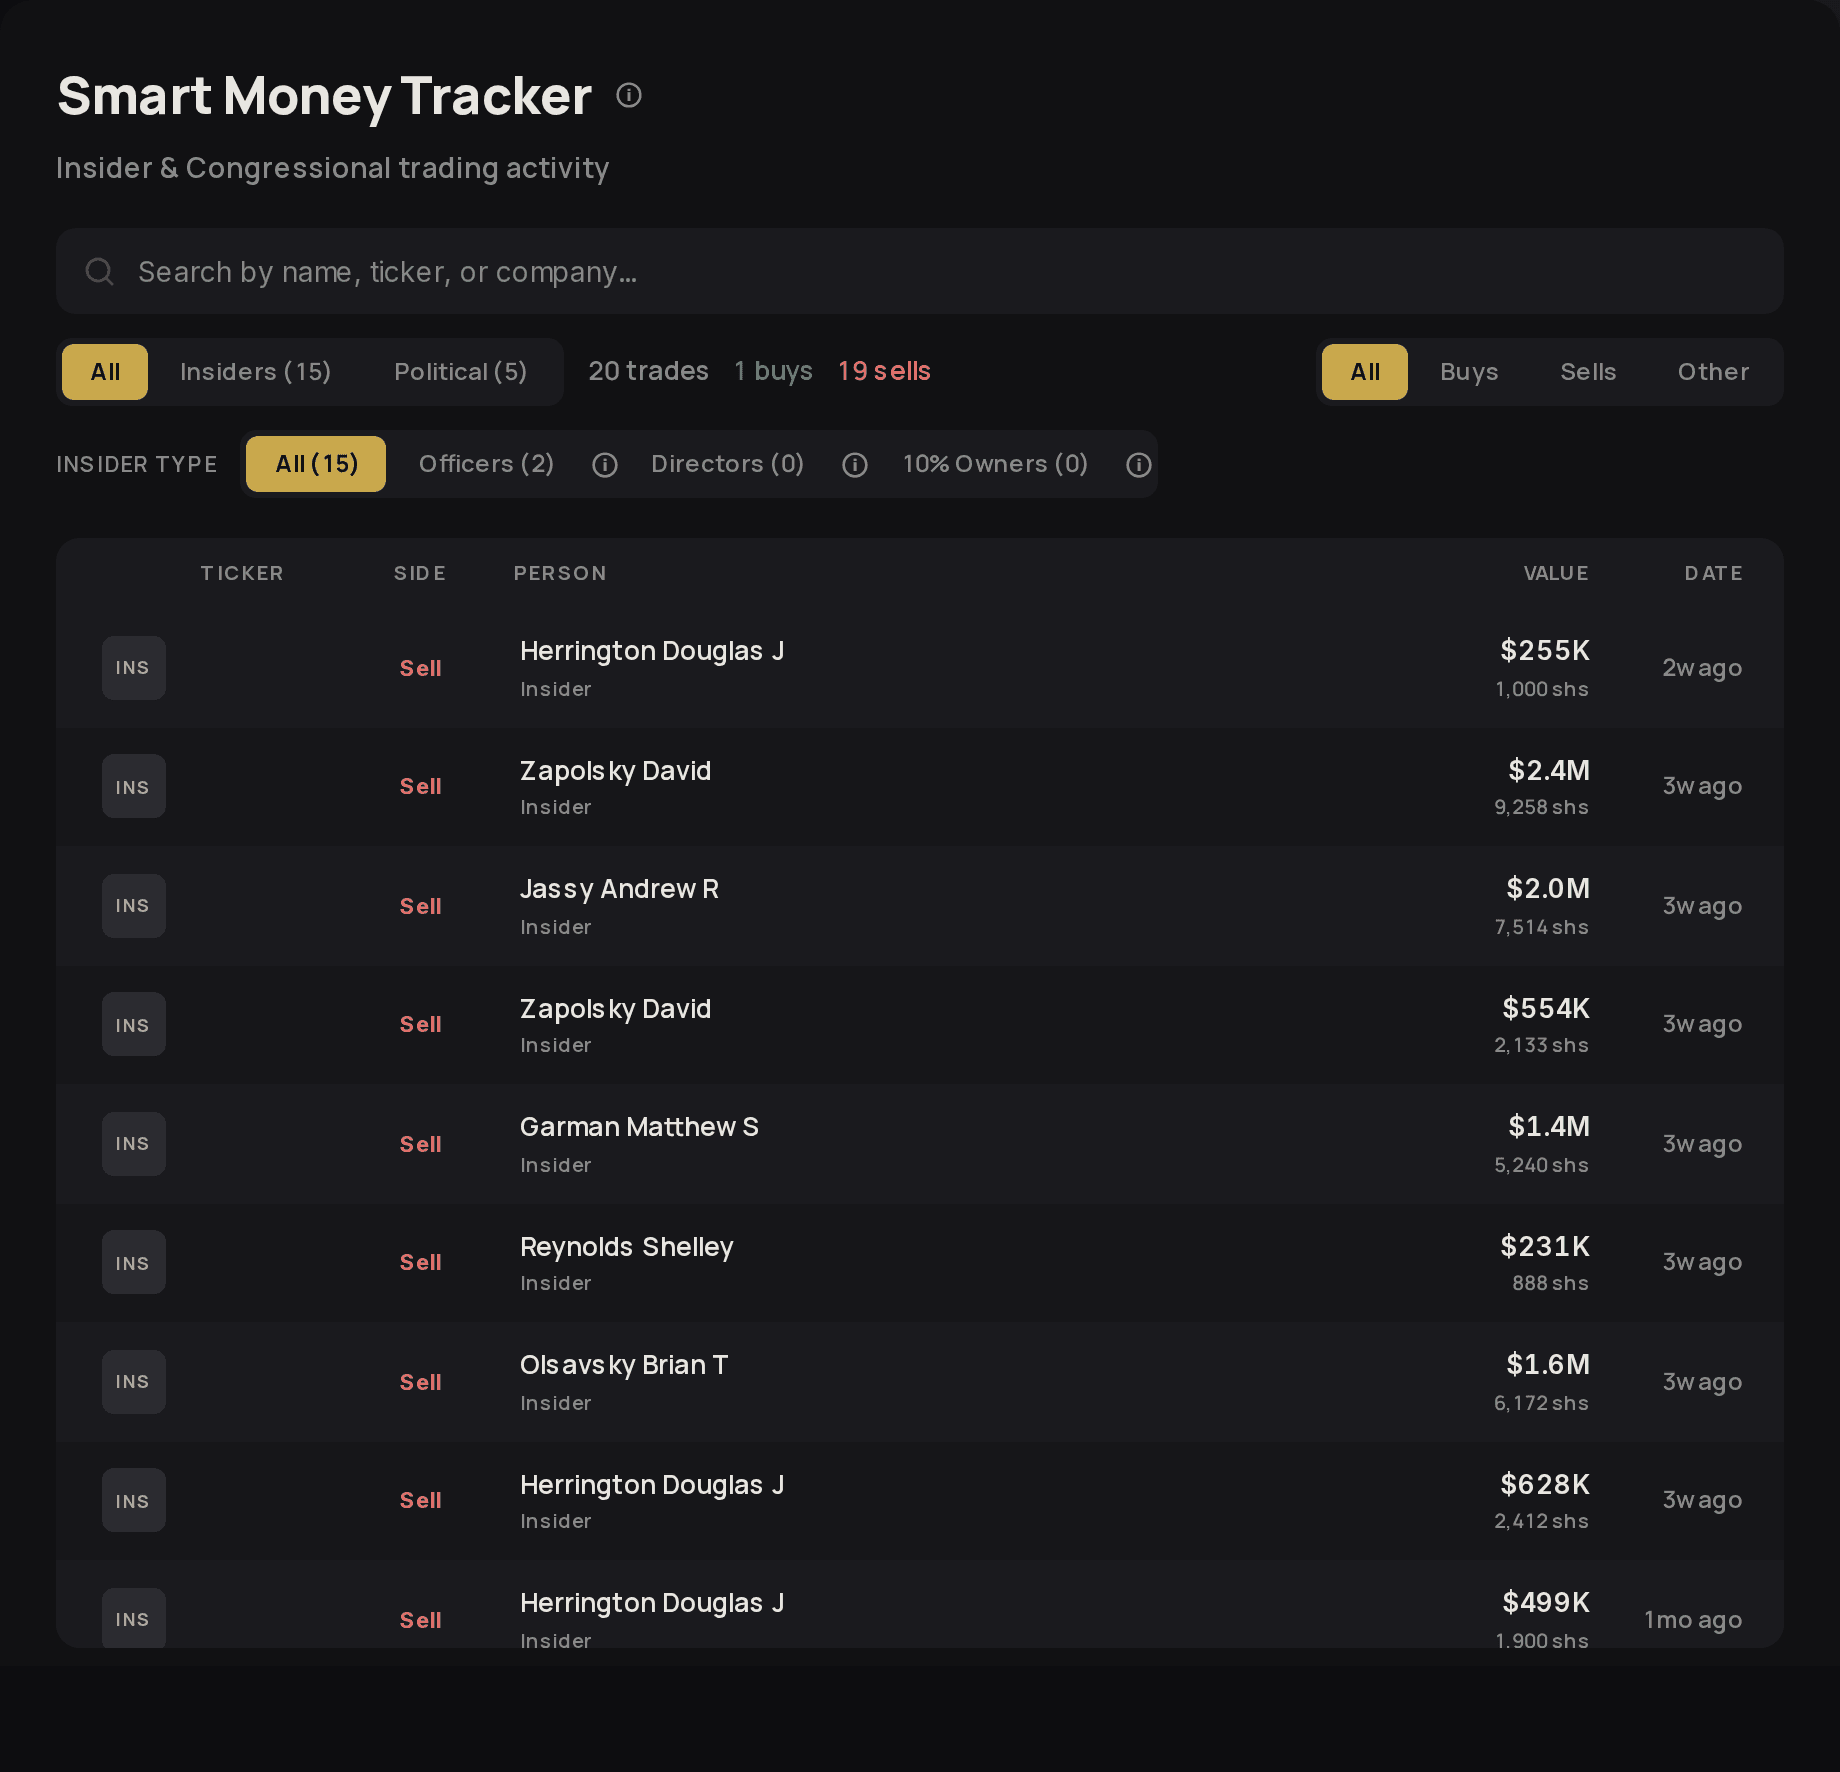
    The Smart Money tracker for AMZN: 20 trades, 1 buy and 19 sells, listing named insiders, side, value, shares and how long ago, as of 16 September 2026.

    How to read it. The ages in the capture (2w ago, 3w ago) count from 16 September 2026.

  15. Page 15Third-party press

    Related news, with links

    What the press said about AMZN in the week before the capture, newest first.

    Headlines from other publications, linked to their source. Not our words.

This report ages. The product does not.

Every figure above is a snapshot of 16 September 2026. New filings, prices and scores land in the product continuously, so the pages this was printed from have already moved on. The same report on a stock you own costs nothing: one per person, no card, usually within minutes.

This is research, not advice. It does not know your situation, and nothing in it is a recommendation to buy or sell anything. Every input behind each number is shown with its date, and the pillars are explained in the docs; how they combine is ours.